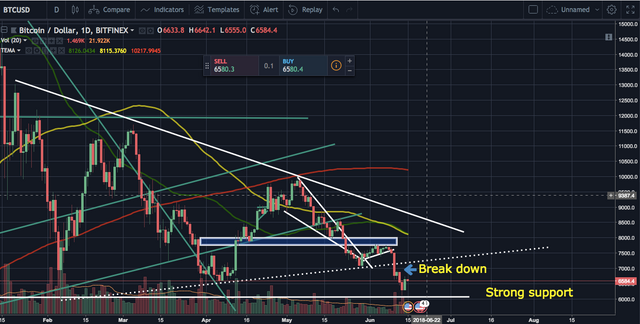
Bitcoin broke down the symmetric triangle
BTC/USD couldn't hold the lower trendline of the symmetric triangle (~$7,100 level - the white dot line) on June 10th and it went down to the next support of ~$6,500. It held a few days at ~$6,500 level but again it's slumped to ~$6,100. The current bitcoin price chart pattern looks like 'triple bottom' if BTC/USD can hold $6,000. If not, this would lead to further sell off and the price may seek ~$5,000 level. The current chart pattern can also be seen as a 'descending triangle', which is usually bearish.
The SEC says that ETH and BTC are not securities
Luckily this morning, the SEC stated that ETH and BTC were not securities. This topic had caused some fear in crypto market but now they confirmed that ETH and BTC are not securities. The market quickly reacted to this news and pretty much all coins were green today. This could potentially help BTC (and crypto market as a whole) form a bottom but we still don't see enough volume to keep pushing up the price higher.

Please upvote and follow me if you like this post. Also, please leave your comment below if you would like to add something to this post.
Did you want me to do some TA on your favourite altcoins? Let me know down below :)
Where I trade : Binance
Follow me on Twitter : Twitter
Disclaimer
I am not a certified financial advisor. This post is just my personal opinion and not financial advice. Please do your own research and do not trade just based on my posts.