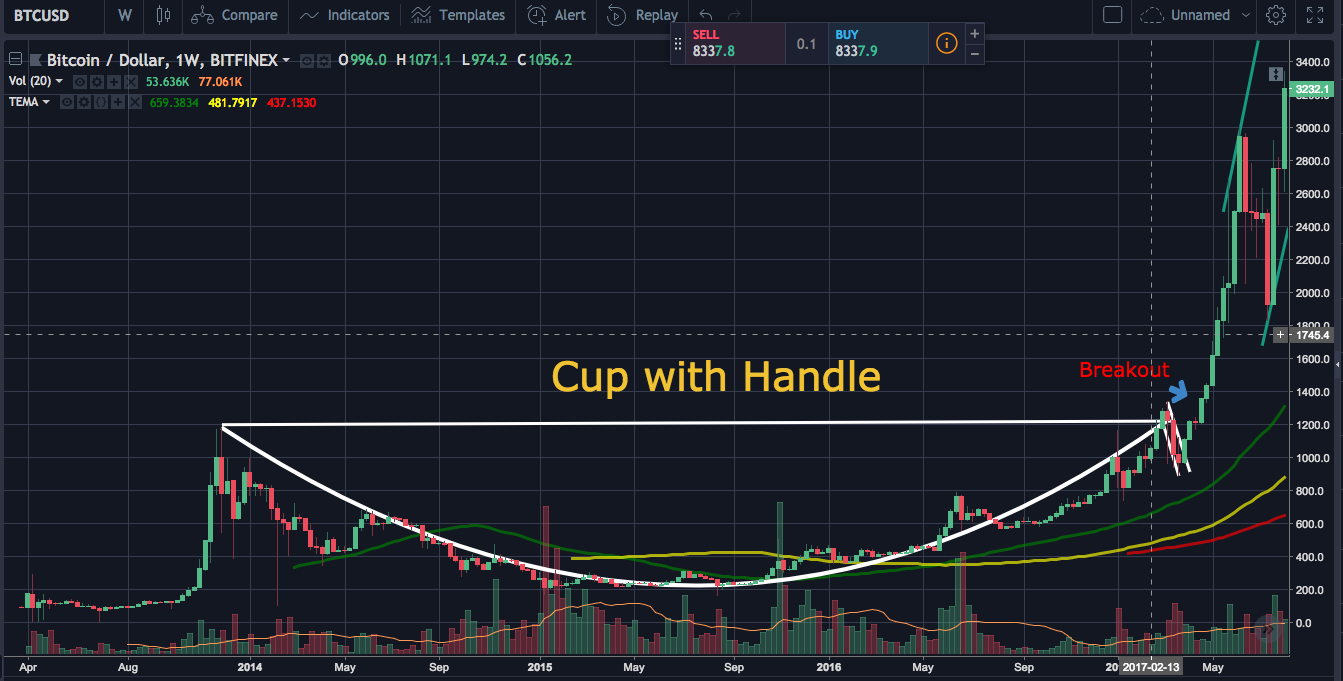
One of the chart patterns I noticed a lot in the crypto market is the 'cup and handle' pattern. The 'cup with handle' pattern usually shows a bullish continuation pattern.
(See the explanation of the 'cup with handle pattern' here Stock chart - cup with handle)
BTC/USD chart formed a huge more than 3 year cup with handle pattern between Dec 2013 and Apr 2017 as shown here below.

After the cup and handle pattern formation and following breakout at $1,200-1,300USD/BTC, the price went up to about $3,000USD/BTC in 2 months as you can see in the chart.
BTC/USD price has experienced a major drop since Dec 2017 and, in my personal opinion, it's currently the late stage of a bottom formation (you can see ~$6,500 double bottom pattern). It's too early to conclude of course but it is possible that BTC is forming another cup with handle pattern. This potential cup with handle pattern may complete by the end of summer as shown in the chart below.

What do you guys think of the cup with handle pattern formation? Let me know your opinion in the comment section below. I will probably elaborate on this topic in the near future.
Disclaimer : I am not a certified financial advisor. This post is just my personal opinion and not financial advice. Please do not trade based on this post.
To the question in your title, my Magic 8-Ball says:
Hi! I'm a bot, and this answer was posted automatically. Check this post out for more information.
Downvoting a post can decrease pending rewards and make it less visible. Common reasons:
Submit
Hello! I'm as new as you, let's develop together. We can achieve a lot if we act together. I followed you, and you follow me. ;)
Downvoting a post can decrease pending rewards and make it less visible. Common reasons:
Submit
Thanks for the follow! I just followed you back!
Downvoting a post can decrease pending rewards and make it less visible. Common reasons:
Submit