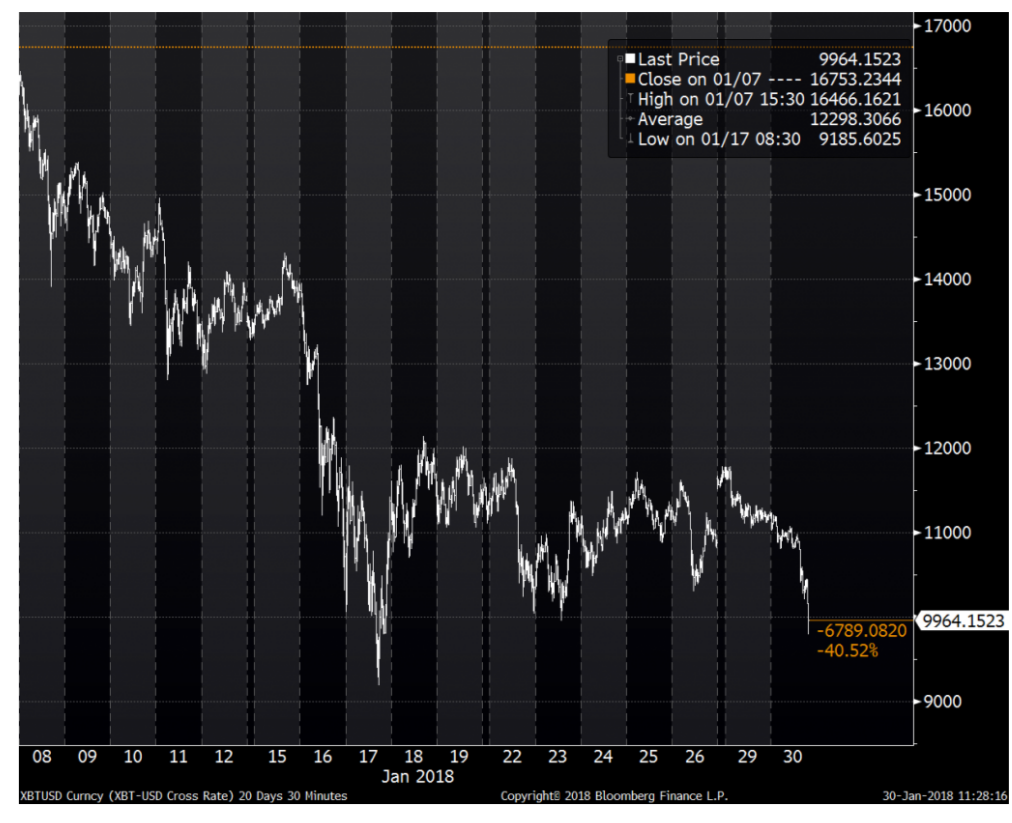
On that day Bitcoin touched $9,100 and then bounced back to $12,000. It has since been range bound between $10,000 and $12,000… until today. Yesterday, Bitcoin broke below the $10,000 support.

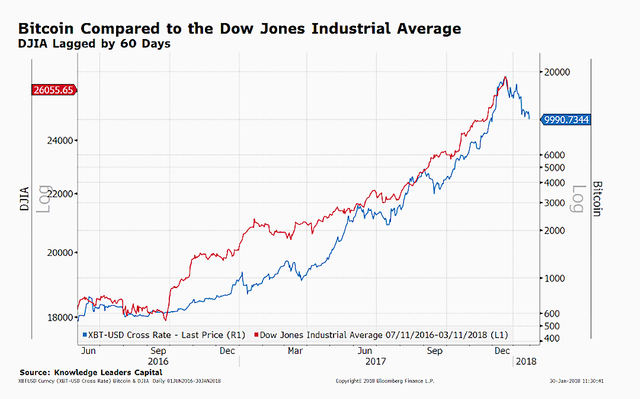
Why is this important? In addition to a strong inverse correlation to gold that I discussed in the earlier blog, Bitcoin appears to have a reasonable correlation to stocks also. In the chart below, I compared Bitcoin to the Dow Jones Industrial Average, the DJA lagged by 45 days. Bitcoin had its melt-up in December and stocks have, until today, had their melt-up in January. Is the speculative peak in Bitcoin something stock investors should take notice of?

The $20,000 blow-off top reached on December 17 has now given way to a 50% peak-to-present decline. Does this relationship prove durable and telegraph a 10% decline in stocks? If so, the recent melt-up in stocks may be at risk.
Bitcoin (BTC) rose $0.89 (+0.32%) in premarket trading Wednesday. Year-to-date, BTC has gained 5.58%, versus a % rise in the benchmark S&P 500 index during the same period.
source-ETF DAILY NEWS
Authors get paid when people like you upvote their post.
If you enjoyed what you read here, create your account today and start earning FREE STEEM!
If you enjoyed what you read here, create your account today and start earning FREE STEEM!
Hi! I am a robot. I just upvoted you! I found similar content that readers might be interested in:
https://etfdailynews.com/2018/01/31/bitcoin-breaks-below-10k-again-next-stop-8k-btc/
Downvoting a post can decrease pending rewards and make it less visible. Common reasons:
Submit