Lately, I'm fascinated by two phenomenons: dollar cost averaging (DCA) and the 'stock to flow' model. The premise of the first is that it's next to impossible to beat the results of DCA and the premise of the second is that it's scarcity that gives value to bitcoin, hence with every halving scarcity increases and you can see this in the price which starts to rise approximately one year before the halving and gets totally overbought approximately one year to a year and a half after the halving.
I've done a few tests myself. But first let me explain the above monthly bitcoin chart. The 3 red vertical lines represent the halvings. The blue rectangles indicate the time period one year before the halving until one year after the halving. The yellow rectangles I'll explain later. The thick yellow line running horizontally is the price of gold (Comex futures). A haven of calm and quiet when compared with the bitcoin price.
The test starts in December 2013, almost exactly at the previous top during the Cyprus crisis. I've done this on purpose because I want to have the worst possible entry moment for DCA. Now the comparison I've made is to buy 100$ of bitcoin every month and see where that would lead you versus saving the same amount and making a lump sum investment at a low level.
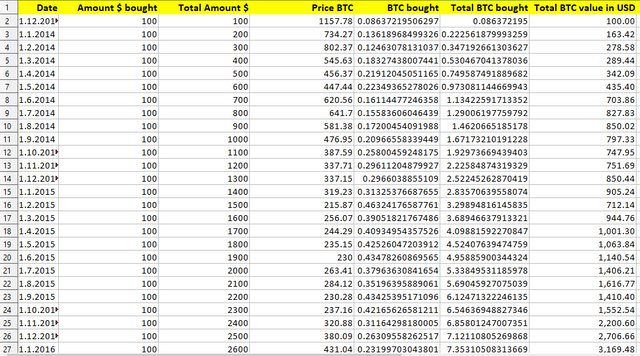
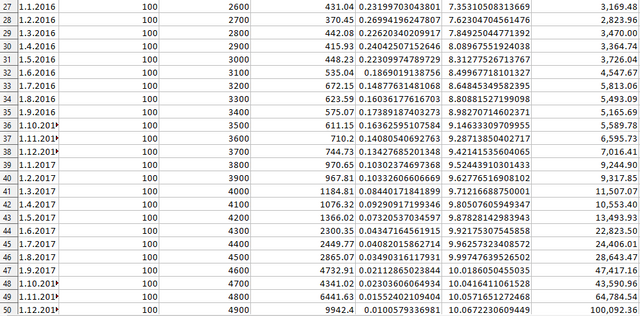
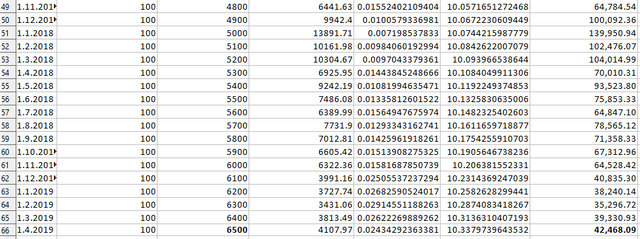
As you can see in the chart, the first breakout occurs in July 2015. By then you would have saved 2100$. So, you could have bought bitcoin on August 1, 2015 at a price of $284.12. That would have given you about 7.4 BTC. Assuming you are an exceptional market timer you may have gotton in around 230$, which would have given you about 9 BTC. Then you have to stay in the position until now. During this time you will have saved $4400. If the month of April stays like this, you can invest these $4400 on the first of May 2019 and I'm going to assume you'll be able to buy approximately 1 BTC for that price. That would leave you with a total of 10 BTC. Which is nothing less than spectacular. You've invested $6500 for 10 BTC which gives you an average price of $650 per BTC.
Now, the dollar cost averaging; and, surprise, it's the same result. You also end up with 10 BTC for the same amount invested. Evidence below.
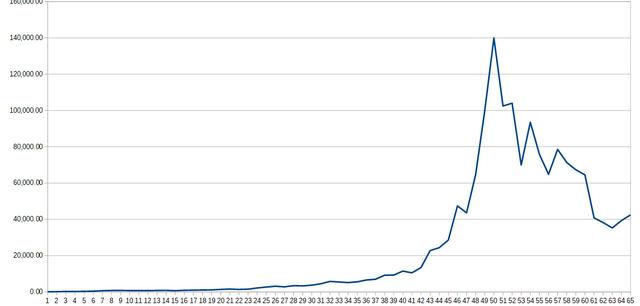
If you make a chart of the DCA investment results, you get below image.
Some remarks.
- During the first downtrend in 2014 and 2015, at the bottom in February 2015, you would have been at a loss of 50%. you would have invested $1500 and your bitcoins would be worth $712.14.
- The maximum value of the portfolio was almost $140,000 in January 2018. We dropped almost a $100,000 to ca 42,500 now. That is a lot.
- Even when you time the markets extremely well, and in my test I've been quite kind with respect to timing your entries correctly, lump sum investing cannot significantly beat DCA.
Of course, the results are spectacular, in both cases. You've invested $6500 for a result of over $42.000 which is about times 6.5. Or, to put it differently, you bought a serious amount of bitcoin with modest amounts of money invested for a glorious average price of $650.
However, it should be possible to improve on this, especially since I knew bitcoin prices were too high when they went over a $1000 in 2013 during the Cyprus crisis. Equally, prices felt very bubbly when they went over $10k during the last bull run in 2017. The trick to improving DCA then, must be, not so much in finding better entries, but in incorporating better exits. If you would have been able to take some BTC of the table around the top, let's say at $10,000 and re-invest this near the bottom, or now, at approximately $5000. you would have significantly increased your BTC holding.
How to do that?
Unfortunately, I don't know yet. About one year after the halving we usually enter bubble terrain and there you probably should not be dollar cost averaging crypto, but something more solid like gold. Later, about one year before the next halving, you can start exchanging gold back to bitcoin again. If, on top of that, you can sell some bitcoin at or near a top, you'll ride the trends to perfection. In order to approximate the top, you probably should be dollar cost averaging out of bitcoin and into gold. But that's a test for another time.


I am surprised because this does not make any sense logically (at least to me it doesn't).
Thank you for putting this together.
Buy low, sell high should theoretically have a better ROI, because you never buy the highs, you sell the highs. Maybe some mathematician can explain this? Why is DCA so good?
Downvoting a post can decrease pending rewards and make it less visible. Common reasons:
Submit
Well, you didn't sell. $2100 was used to buy 9 BTC. If you had sold them at, say 10k$, you would have made 90k$ or double what you have now. Probably you can now buy 18 BTC with that. If you had sold at 15k$ you could now buy 27 BTC. The question is: would you have sold at 10 or 15k$? Maybe you would have sold earlier, much earlier, or not at all. And what if the rise had continued to 50k$? It's not so easy.
Another point is that with DCA you keep buying. Buying 9BTC in the summer of 2015 will leave you with 9 BTC at the top in December 2017. With DCA you had about 5.5 BTC in the summer of 2015, but 10 BTC at the 2017 top. Granted, by then you had invested $4900, which is 2800 more. But you also have a BTC more.
Downvoting a post can decrease pending rewards and make it less visible. Common reasons:
Submit
Now I understand the difference. That is why I use a laddering strategy for selling.
Downvoting a post can decrease pending rewards and make it less visible. Common reasons:
Submit