And we're making new lows in the correction. Nobody will be surprised. That said, we do seem to be in oversold terrain and the indicators even point to divergence, so, at least a sideways movement seems likely . I have opened a small long position. That is despite the fact that I do not think we have seen the bottom of this correction. However, being a correction, it should move in a choppy way, I am therefore playing for a bounce.

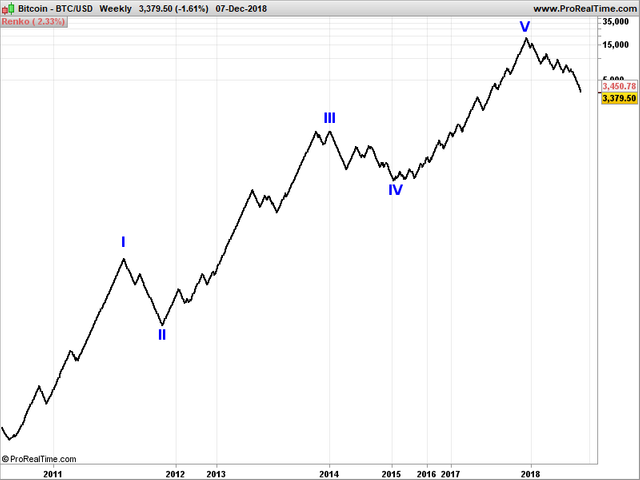
Let's have a look at the larger picture above.
This chart is from Prorealtime which has bitcoin data (free) from July 2010, when bitcoin was still trading below 10 cents. What we are looking at is a so-called Renko chart. A Renko chart measures only price movements above a certain threshold, in this case 2.33%. A new Renko brick is displayed for every 2.33% move, either up or down. This is a good way to filter out noise, which, especially for Elliott wave counts, can be quite useful.
We can see a clear five wave Elliott impulse up, which is now correcting. And, according to this Elliott count, could correct to the wave IV low which is at approximately 250$. If that happens, sell the family jewels, sell the house, sell everything in exchange for crypto. But will we get there?

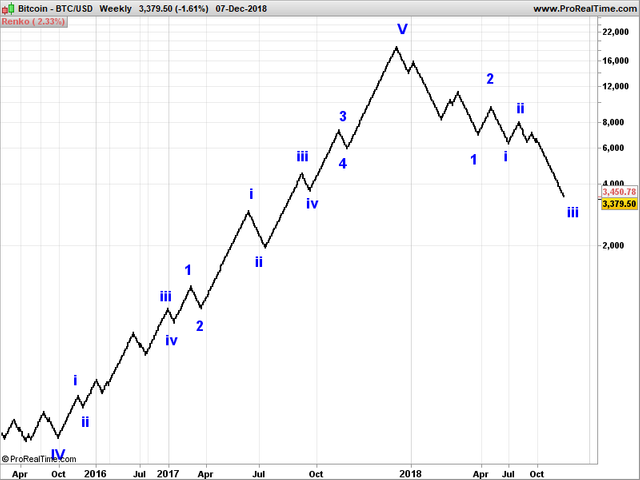
When we zoom in to the wave V up and the correction down, first it must be stated that a completed five wave can be counted inside wave V; meaning this wave has most likely ended and the ongoing correction is not part of this wave V.
Secondly, the correction is moving down hard and there seems to be no sign of even a slow down, at least on this chart.

Is there nothing positive to say?
Of course there is.
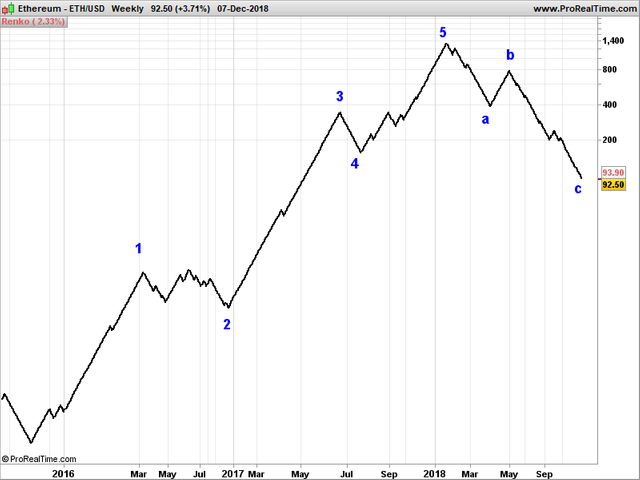
When we look at the above ethereum chart we can see a completed five wave and a correction which has already surpassed its wave 4 target. In other words: ethereum is ready to go up hard.
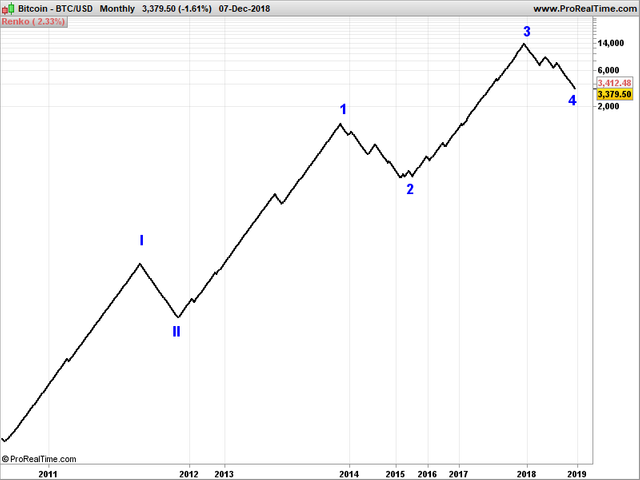
As we know, most crypto coins move in tandem, so if this scenario is to play out then there must be another bitcoin count to accompany it.

For instance the one above, which is actually my preferred count. Why? The move towards 20k$ was too young, too fast, too enthusiastic to be a wave V top which must display signs of exhaustion. In that sense the move was similar to the Internet hype of the nineties. Of course, there was a lot of insanity going on, but the technological promise was just too big to be ignored. And we have made new highs on the Nasdaq since, be it with different companies as many overhyped ones, or not well managed ones, failed. Others, however, have grown to gargantuan proportions. This growth path might very well apply to crypto. In the above monthly chart, there is enough upside potential, possibly for a lifetime even. In addition, the alternative points to a target of 250$. This is just too low for bitcoin. I simply do not believe it.
cool info, thanks
will be interesting for sure, should turn soon in some way
could go to around 15-20k again then down to that sub 1k mark.. that could work in EW as well
Downvoting a post can decrease pending rewards and make it less visible. Common reasons:
Submit
Oh yes. But I don't think this is the bottom. If we get a bounce to 4 or 5k, followed by a drop to new lows - so we get a nice divergence on the charts and a completed five wave down - then, maybe, we've had it.
Downvoting a post can decrease pending rewards and make it less visible. Common reasons:
Submit