While tomorrow is most likely going to be pretty similar to today, uncertainty remains one of the main components of life. Hence the always present desire to acquire some insight into the future. Nowadays of course, we are civilized, so we no longer read Tarot cards, the flight of the birds or the positions of the celestial bodies. Today, we make models.
Now, it wouldn't surprise me if the ancient methods turned out to be more reliable than the modern ones as I have little confidence in either economic nor climate models - I simply do not believe the future is a function of mathematics. However, in the same sense as there are good doctors and bad doctors, some of us may read mystical signs better than others and some models can actually be quite helpful. Even some processes, like the relation between scarcity and price, might follow a mathematical principle and can therefore be plotted into the future.
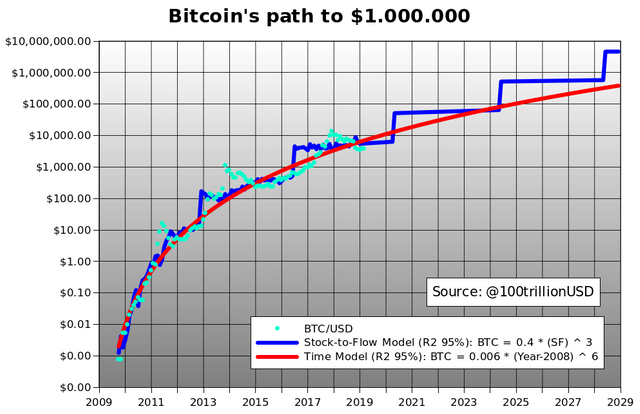
I came across the above chart, a so-called 'Stock to Flow' model, made by someone who calls himself PlanB. How he gets to this chart is described here (https://medium.com/@100trillionUSD/modeling-bitcoins-value-with-scarcity-91fa0fc03e25), as well as here (https://twitter.com/100trillionUSD).
What strikes me is the remarkable, almost 1-on-1 relation between the bitcoin price and this model. Currently, following this model, we are oversold. Which will not surprise any one. Also, we had a similar situation in 2015, after the Cyprus crisis, when prices stayed oversold for the larger part of the year. Until, shortly before the next halving, another bullrun started.

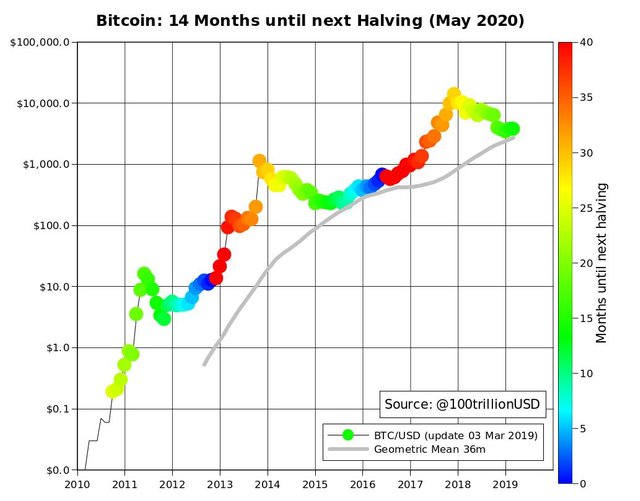
Speaking about halving, PlanB gives above chart describing the time distance to the halving by colouring price dots. The dark blue one is where the halving occurs. We can easily see that prices rise into the halving and continue for some time to come until bubbling up too high.

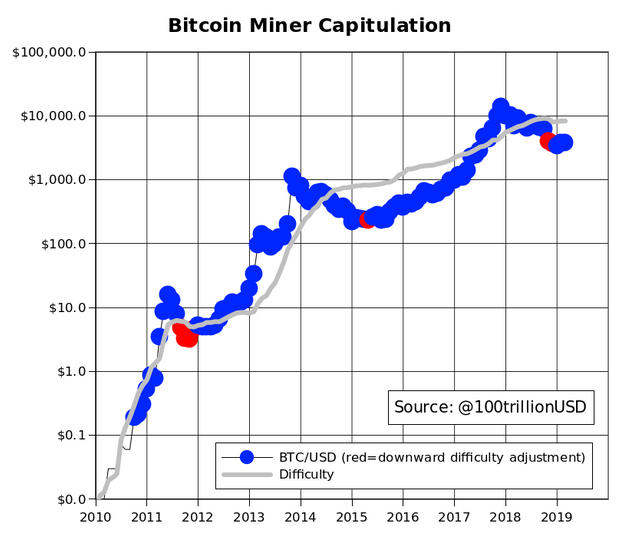
Another chart I found very interesting is the bitcoin miner capitulation illustrating a significant drop in mining difficulty, visualised by the red dots, which can only be the result of miners leaving the business. An event that must be interpreted as a sign that we're close to a bottom; as confirmed by the previous red dots and the subsequent price rises. That said, my preference remains for prices to first drop to a new bottom. Then, it will get extremely interesting.
Very interesting charts, thanks for sharing
Posted using Partiko iOS
Downvoting a post can decrease pending rewards and make it less visible. Common reasons:
Submit
My pleasure!
Downvoting a post can decrease pending rewards and make it less visible. Common reasons:
Submit
Very interesting and this is an interesting and healthy growth.
Posted using Partiko Android
Downvoting a post can decrease pending rewards and make it less visible. Common reasons:
Submit
Indeed, I will try and monitor these charts because if they are correct, well, investing has never been easier.
Downvoting a post can decrease pending rewards and make it less visible. Common reasons:
Submit