Bitcoin Price Consolidates Gains Below $28,000 Resistance Zone
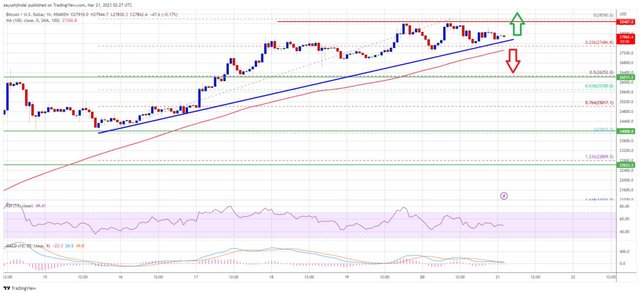
Bitcoin's price made several attempts to surpass the $28,000 and $28,400 resistance levels but struggled to gain momentum above them. The bears were active near the $28,500 level, resulting in a high of $28,590. Currently, the price is consolidating gains below the $28,000 resistance, which could prove to be a significant hurdle.
Key Levels to Watch
At the time of writing, Bitcoin is trading above $27,000 and the 100 hourly simple moving average. The hourly chart of the BTC/USD pair from Kraken indicates that there is a major bullish trend line forming with support near $27,700. Additionally, the 23.6% Fib retracement level of the upward wave from the $23,912 swing low to $28,590 high was tested after the price moved below $28,000.
Potential Downside Correction
If Bitcoin's price fails to stay above the $27,700 support level, it may trigger a downside correction. A break below the $27,200 support could pave the way for further losses. In this case, the next major support level to watch out for would be near the $26,000 zone.
Conclusion
Despite Bitcoin's attempts to surpass the $28,000 resistance zone, it is currently consolidating gains below it. The bullish trend line forming near $27,700 may provide support for the price in the short term. However, a downside correction cannot be ruled out if the support levels are breached. Traders should keep an eye on the key levels and trend lines before making any investment decisions.

Bitcoin Price Analysis: Key Levels to Watch for Upside and Downside Moves
Bitcoin's price is currently facing a significant resistance near the $28,500 zone. However, it remains well supported above the $27,000 level and the 100 hourly simple moving average. Let's take a closer look at the key levels to watch for potential upside and downside moves.
Upside Potential
If Bitcoin's price manages to break above the $28,500 resistance, it could trigger another steady increase towards the $29,500 level. The next major resistance to watch out for is near the $30,000 barrier. However, the bears may take a stand at this level, leading to a potential price correction.
Immediate resistance is near the $28,200 level, followed by the $28,500 zone or the recent high. A clear break above these levels may open up further upside potential.
Downside Risk
If Bitcoin's price fails to clear the $28,500 resistance, it may trigger a downside correction. The immediate support level on the downside is near the $27,700 zone and the bullish trend line. A break below this level may pave the way for further losses.
The next major support levels to watch out for are near the trend line and $27,200, followed by the 50% Fib retracement level of the upward wave from the $23,912 swing low to $28,590 high at $26,250. The next key support level is near the $25,700 zone.
Technical Indicators
The hourly MACD for BTC/USD is currently losing pace in the bullish zone, which may lead to a potential price correction. Meanwhile, the hourly RSI (Relative Strength Index) is near the 50 level, indicating a neutral market sentiment.
Conclusion
Bitcoin's price is currently facing a significant resistance near the $28,500 zone, while remaining well supported above the $27,000 level and the 100 hourly simple moving average. Traders should keep an eye on the key levels and technical indicators before making any investment decisions. A clear break above the $28,500 resistance could pave the way for further upside potential, while a break below the support levels may trigger a downside correction.