What Are Indicators?
Traders utilize indicators to predict how the market will move. They can be used to display price patterns. Strategies can then be devised to exploit these patterns. They are also used to keep abreast of any news or movements in other markets that may affect the price.
What Are the Best Indicators For Technical Analysis?
Technical analysis is a technique for predicting the direction of an asset's price based on the asset's prior market price and volume. Some highly valuable technical analysis indicators can be used to increase your chances of success.
Some of the best technical indicators for trading include Relative Strength Index (RSI), Bollinger Bands, and On Balance Volume (OBV), Moving Average Convergence Divergence (MACD), which we’ll look at in this article
RSI

The RSI is used to determine an asset's weakness or strength based on recent price fluctuations, and it can be used to determine if an asset has been overbought or oversold. This is how you figure it out:
RSI = 100 – 100 / (1 + RS)
RS = Average of price increases over time / Average of price decreases over time
The standard number of periods is 14, although the trader has complete control on how many to utilize.
If the value is less than 30, the asset has most likely been oversold. On the other hand, if the value is greater than 70, the asset has been overbought.
Bollinger Bands

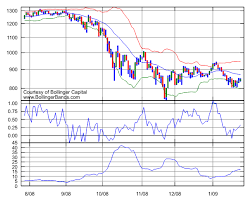
The Bollinger Bands is an indicator that is used to determine the movement of an asset’s price within a band by allowing the width of the upper and lower bands to move together with price fluctuation. If you see the price of an asset move out of the upper and lower bands, then a price reversal may be imminent. It can be interpreted as follows:
Middle Band – Simple Moving Average over 20 days (SMA)
Upper Band – SMA over 20 days + (Standard deviation of price over 20 days x 2)
Lower Band – SMA over 20 days – (Standard deviation of price over 20 days x 2)
OBV

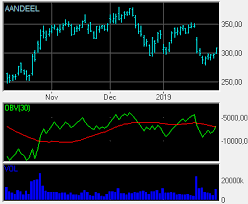
OBV is an indicator that uses the volume flow of an asset to predict price changes and to determine how strong signals are to buy or sell an asset. It is used as a cumulative indicator, meaning that:
If an asset’s price closes up, the volume for that day is added to the OBV’s total.
If an asset’s price closes down, however, the volume for that day is taken away from the OBV’s total.
If it is the same, no calculations are made.
The concept is really quite simple – if there is a higher high (unless there is a resistance zone), this means there is positive volume pressure, and there is a good chance that the price will increase. And the opposite is true with a lower high, unless it (hits a support zone). This means there is negative volume pressure, and there is a good chance that the price of an asset will decrease.
MACD

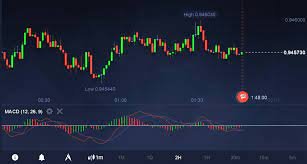
Trend-following momentum is indicated by the MACD formula. This is how you figure it out:
26 period EMA (Exponential Moving Average) – 12 period EMA (at closing prices)
If the MACD is positive, this suggests that the market is moving upwards. A bullish cross occurs when the MACD slopes higher near crossing the signal line (as shown below) and can be perceived as a good moment to buy. If the MACD is negative, it means there is negative momentum on the downside. A bearish cross occurs when the MACD slopes downward and crosses the signal line, heading below it. This can be seen as a favorable moment to sell.
Click here to learn how I make $1000 per day with crypto and you can also do it:- https://lemon10492228.brizy.site/