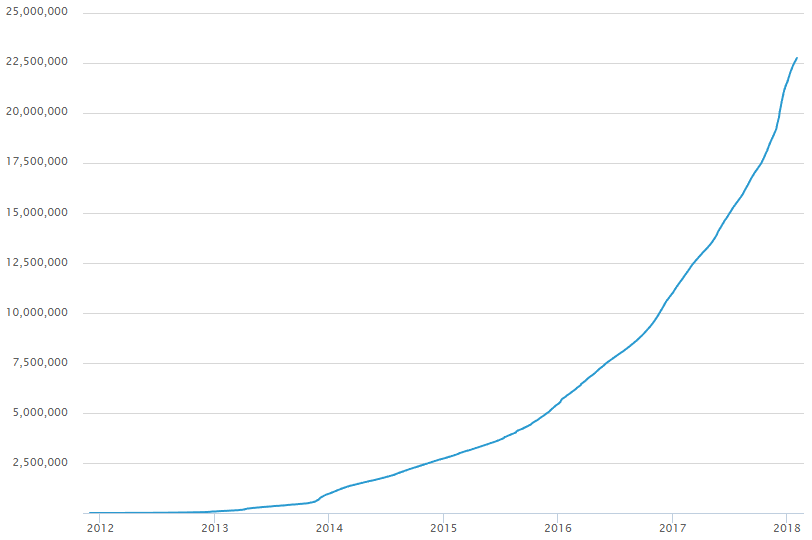
You probably know the chart here:
https://blockchain.info/de/charts/my-wallet-n-users

The problem with this is that it adds up all wallet users and it's hard to see any details there.
It looks like a softly drawn curve.
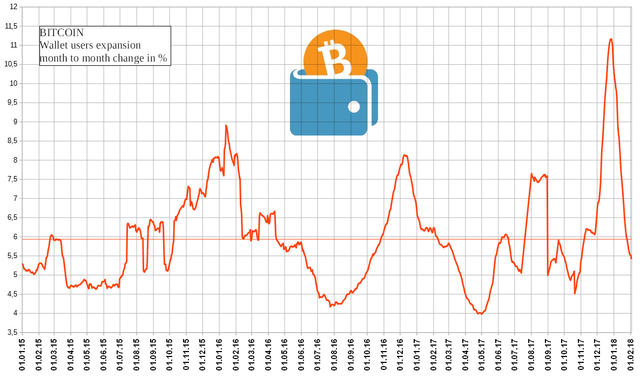
I have created a chart that shows the user wallet growth much more clearly.
But a click on "CSV" (blockchain.info chart above) is not enough.
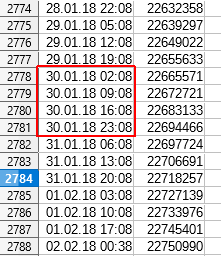
The CSV file contains data at irregular intervals.
Sometimes there are 4 entries for a day.
That doesn't make it easy.

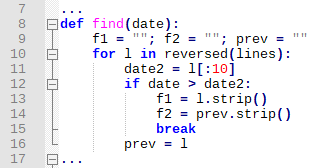
I have therefore written a Python-Scipt, which converts the number of wallets for the same hour every day.
The result is a new CSV file.
This makes it easier to work with.

I have now calculated the monthly/monthly change since 2015 and created a chart from it.
Wow - here you can see much more details.
Details you wouldn't otherwise see.
It is remarkable that on average there are about 6% new wallets every month.
However, growth is not smooth and linear, but very volatile.
There has never been negative growth below 0%.

Support me, then I bring more such interesting charts.