Bitcoin – November 19-26, 2023 Neural Network Modeling
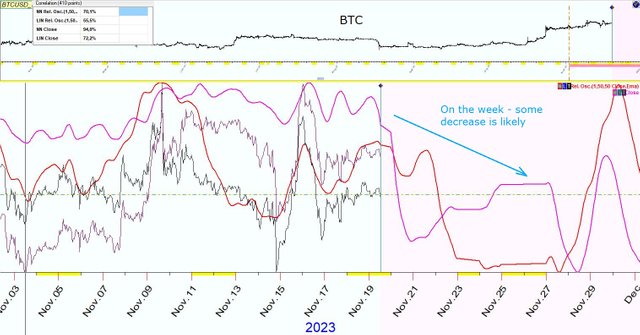
On the week - some decrease is likely
The chart below shows a simulation of the movement of the RPO indicator (Relative Price Oscillator “MA1-1, MA2-50, MA3-50”) of Bitcoin on the hourly timeframe (history from the beginning of 2023), built by a neural algorithm.
Purple line - simulated Bitcoin price movement
Red line - simulated movement of the RPO indicator
