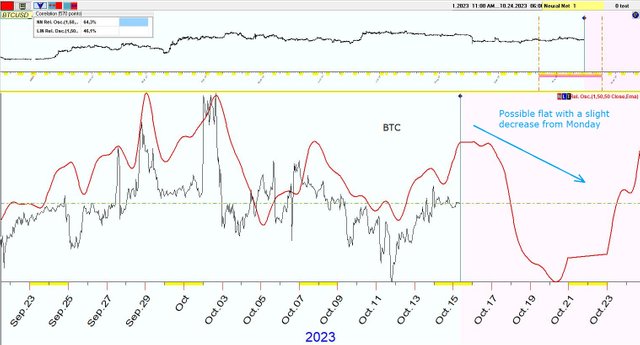
Bitcoin – October 15 to October 22, 2023 Neural Network Modeling
Possible flat with a slight decrease from Monday
The chart below shows a simulation of the movement of the RPO indicator (Relative Price Oscillator “MA1-1, MA2-50, MA3-50”) of Bitcoin on the hourly timeframe (history from the beginning of 2023), built by a neural algorithm.
The black line is the real story of the RPO indicator.
The red line is the simulated movement of the RPO indicator.
Please repost. Thank you!

You've got a free upvote from witness fuli.
Peace & Love!
Downvoting a post can decrease pending rewards and make it less visible. Common reasons:
Submit