MENU
Show navigationFXStreet
Ken Chigbo Ken Chigbo
FXStreet
Follow
Bitcoin technical analysis: BTC/USD needs to breakdown $12,000-12,500 for chance at $15,000
CRYPTOS | Jun 28, 15:20 GMT
Share on Twitter Share on Facebook Share on Linkedin
Bitcoin price is trading in positive territory, gains of some 5% on Friday in the second part of the session.
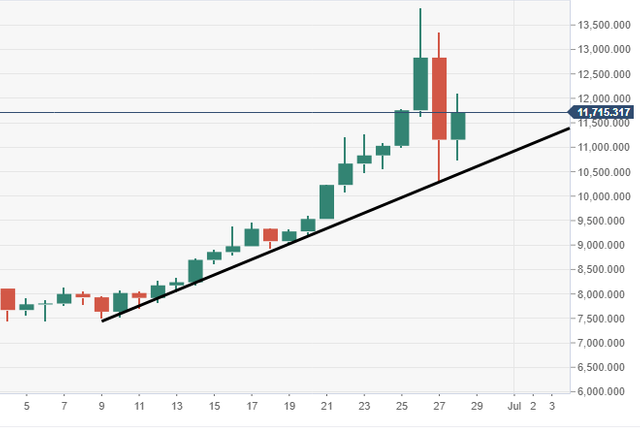
BTC/USD managed to catch support from an ascending daily trend line.
The price underwent a large correction on Thursday, which has seen the bulls buy those dips.
Spot rate: 11,725.45
Relative change: +5.50%
High: 12,099.98
Low: 10,739.16
BTC/USD 60-minute chart
Near-term ascending channel formation, which could be viewed as a bearish flag.
.png)
BTC/USD daily chart
Price action via the daily has managed to catch support from an ascending trend line.

There is no reason to expect the BTC price to continue its incredulous moonshot without a temporary retracement unless you are trading it for fast gain only. Have patience.
Downvoting a post can decrease pending rewards and make it less visible. Common reasons:
Submit
Yup your absolutely correct!
Downvoting a post can decrease pending rewards and make it less visible. Common reasons:
Submit