Greetings! It seems that the crypto market is having a correction. Honestly, I feel not good. But, I need to endure this correction. After this correction is over, I'll be happy 🤗
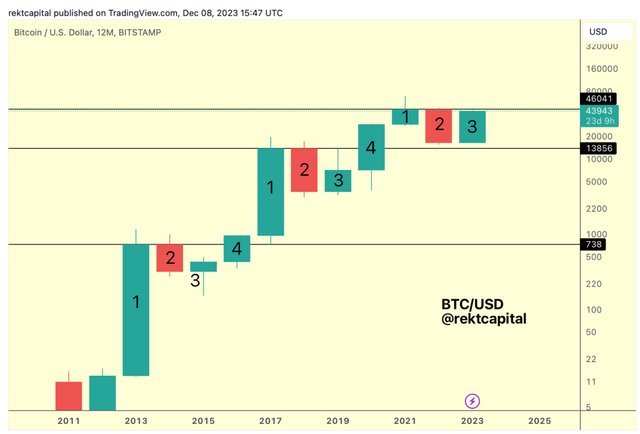
By the way, did you find something in common this chart? Every 4th green bullish candlesticks are longer than every 3rd green bullish candlesticks. Furthermore, every 3rd green bullish candlesticks ATH(All Time High) are lower than every 2nd red bearish candlesticks ATH. So, this correction may be lasting until this Dec.
Next year, there are lots of things waiting for us. Decisions of spot BTC ETF(Exchange-Traded Fund) applications approvals, the 4th BTC halving, the possibility of a next recession, etc. I think next year is more optimistic than this year. So, in my opinion, next year candlestick will be longer than this year's candlestick. Do not be bitten by the bear 🐻