You have probably heard the term "long term" ever, usually referring to a period of time greater than or equal to 1 year, being used for planning or predictions.
Several analysts and platforms have tried to build a meter for the prices of cryptocurrencies, looking to condense their volatile behavior and understand it in order to anticipate it. The problem is that the changing nature of virtual currencies complicates their work, causing many to fail.
Although this limitation does not prevent other types of long-term studies, especially those that study backwards, that is, the behavior of virtual currencies in the elapsed time.
Currently the most famous platforms for this type of analysis with CoinMarketCap and Bitfinex, differing in the values they use for their analyzes.
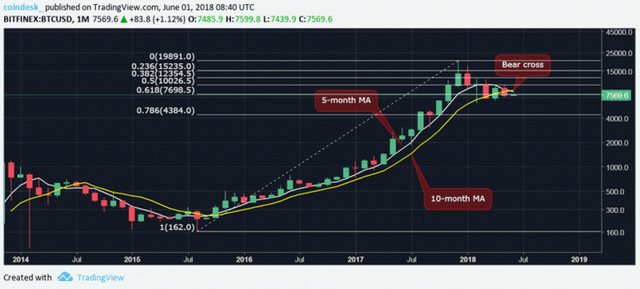
This time we will explain about Bitfinex for a recent report that they made about the Bitcoin price in the long term, which poses a significant drop in its growth. The report was explained by CoinDesk analysts, starting with the following graph:
This diagram reflects the BTC price values in terms of years, which reflects an upward trend since the fall of 2015, obtaining positive growth values despite the short falls that occurred in those years. The problem occurs this 2018, with the worst fall of BTC so far, which can be seen in the graph.
The current fall was of such magnitude that it is impacting the long-term value of BTC. CoinDesk analysts emphasize that if a downward trend continues in the long term, 2018 could be the worst year for this currency.
Impact of the Report
As we expressed, the nature of virtual currencies is volatile, allowing its price to be affected by cases as simple as a statistical report. CoinDesk analysts said the recovery could be affected.


To the question in your title, my Magic 8-Ball says:
Hi! I'm a bot, and this answer was posted automatically. Check this post out for more information.
Downvoting a post can decrease pending rewards and make it less visible. Common reasons:
Submit