In our last article, we explained about trends, support and resistance levels and trendlines. An additional trendline technique makes use of channel lines.
Drawing channel lines
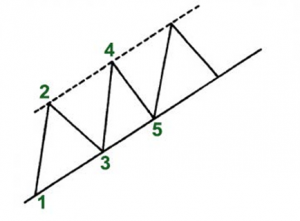
In an uptrend, first draw the basic up trendline along the lows as shown in the figure below (points 1, 3, 5). Then draw a dotted line parallel to the basic trendline (starting from the first peak, at point 2). Both the dotted and basic lines move in the right direction and form the channel. If the price increases and the next rally reaches and backs off from the channel line (by point 4), then a channel may be spotted. If the price declines and falls back to the basic trendline, (point 5), then we can conclude that a channel exists.

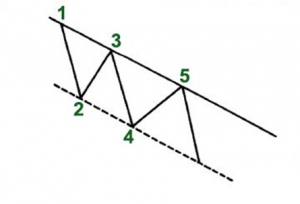
The same applies to a downtrend, in the opposite direction, however.

When a basic trendline breaks this signals an important trend change
Regardless whether a channel is upward or downward, the interpretation stays the same. HitBTC traders expect a particular currency to trade between support and resistance levels until it breaks beyond one of these levels. Besides clearly indicating the trend, channels are mainly used to emphasize the important areas of support and resistance. As such they are used for short-term profit trading.
Similar to a trendline, the longer the channel remains intact and the more often it is successfully tested, the more reliable it will be. But it is important to note that while the breaking of the basic trendline indicates an important trend change, the breaking of a rising channel line indicates an acceleration of an existing trend.
The basic trendline is the most reliable of the 2. In technical analysis, the channel line is mostly considered a secondary use of trendline technique.
Check for price gaps
Price gaps are also very meaningful indicators to include in your trading strategy. They represent areas on a HitBTC chart where no trade has been executed. These open spaces mostly appear on daily charts, but can also be seen in weekly or monthly charts.
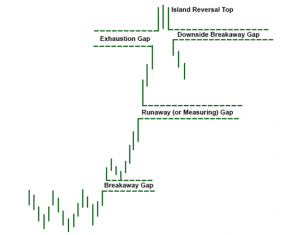
3 types of price gaps can be discerned: breakaway, runaway, and exhaustion

The breakaway gap can appear when an important price pattern is completed. This usually marks the beginning of an essential market move. This type of gap can also show up when a major trendline breaks. It signals a reversal pattern.
The runaway (or measuring) gap typically emerges somewhere in the middle of the move when prices form a second gap. In an uptrend, this kind of gap demonstrates market strength, while in a downtrend it signals market weakness.
The exhaustion gap manifests near the end of the market move when the breakaway and runaway gaps have already been identified. Sometimes after the formation of an exhaustion gap, prices first trade in a narrow range for a few days and only then gap to the downside.
The exhaustion gap to the upside, followed by a breakaway gap to the downside completes the island reversal pattern. More info on reversal and continuation patterns will be provided in another post.
Candlestick charts are essential trading tools
In technical analysis, charts form the most essential tools to trade the market. Charts are graphical representations of price movements over a certain time frame. The most used timescales are intraday, daily, weekly, monthly, quarterly and annually.
Most financial trading is done by using Japanese candlesticks
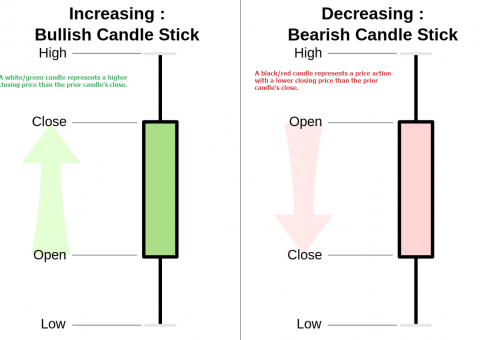
Nowadays most HitBTC financial trading, both in fiat as well as in crypto coin markets, makes use of Japanese candlestick charts. Candlestick charts plot 4 prices, the same as in the classic bar chart: high, low, opening and closing. The difference between the 2 types of charts lies in the clearer visualization when using candlesticks.

The formation of a wide bar shows the difference between opening and closing prices. A thin line, also called the shadow, displays the price change from high to low. The wider portion of the bar, called real body, indicates the distance between opening and closing prices. Colors are used to clarify the price performance over the trading period. A green (or white) real body is used when the closing price is higher than the previous candles close. A red (or black) real body indicates a lower closing price than the previous candles close.
Japanese candlesticks provide a versatile technical system. Used in combination with other technical analysis tools, it will provide you a powerful set of techniques to further enhance your HitBTC trading skills. Next posts will cover this more in depth.
Source: Technical Analysis Explained (by IFC Markets)
Posted from my blog with SteemPress : http://companywebsolutions.com/more-technical-analysis-tools-to-trade-the-market-on-hitbtc/