How To Analyze Crypto Currency Trading Charts
First, let me introduce myself. My name is Matt, I am a small time entrepreneur with a background in chemical engineering. I own a locksmithing business and a website called mybitcoin.academy. I have spent the last 6 months figuring out how I can maximize my profit out of the volatile crypto market. The growth for the last 6 months has me kicking myself for not investing everything that I had available into so many promising blockchain techs.
An Introduction To Trends
What is a trend? A trend is simply a point on the chart that appears over and over again. This can be in the form of many patterns but mostly you will see it indicated by a linear line. Below you will see a chart of STEEM trading on Bittrex from March - Present.
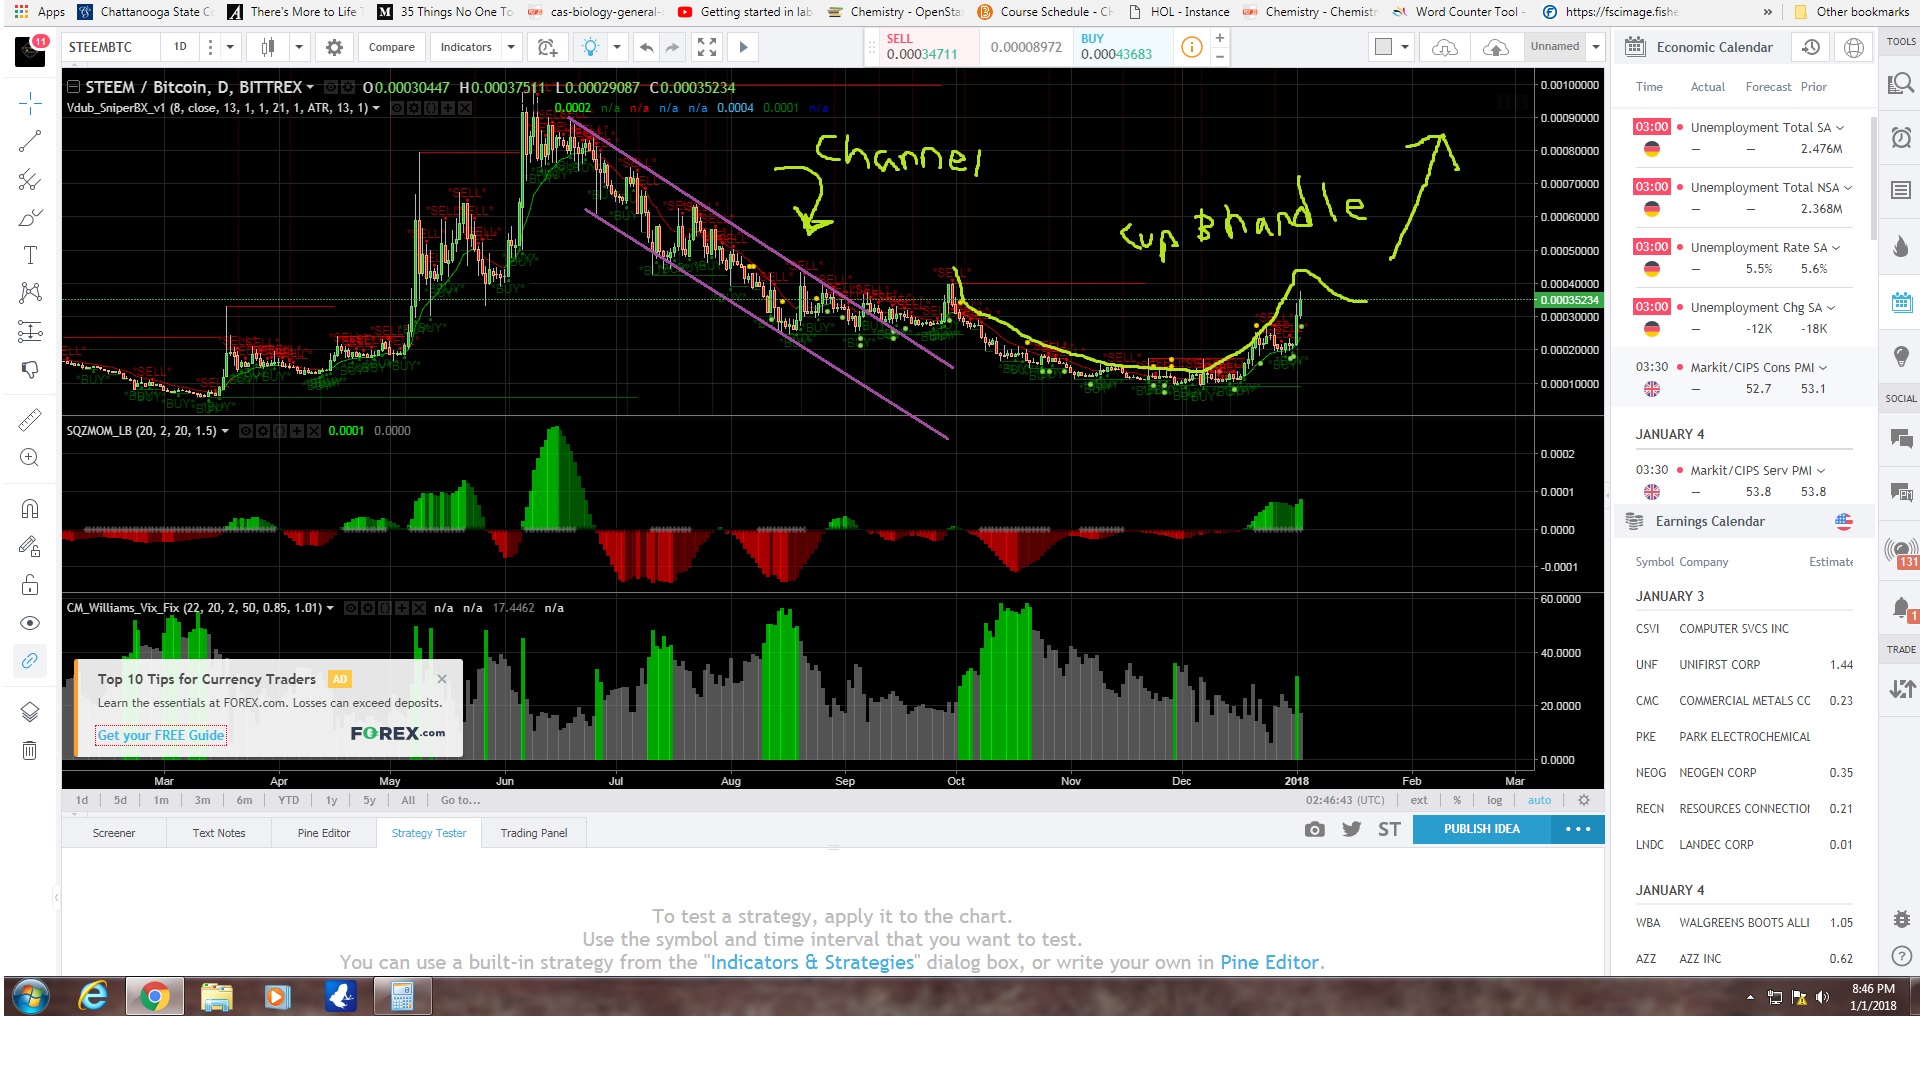
As you can see I've indicated a past trend that is descending. What was formed is typically called a channel pattern. A channel pattern will give you the ability to profit off of very short trades in a bearish market. Super important if you don't feel like holding your investment in place for months at a time just to break even.
How To Find A Trend
First you will probably want to go to what I consider to be the best tool for learning how to analyze charts. You can find what I'm talking about Here This is a trading tool that lets you watch and draw on live trading information.
Now, the best way to find a trend is to do a best fit line across a very long trading time. If you are looking for a long term investment then you probably want to analyze the chart in 4 hour increments as opposed to 30 minute increments.
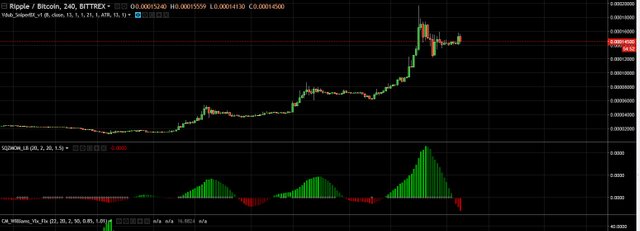
Take a look at the chart, it should look something like this. The image below is what XRP/BTC is looking like on Bittrex right now. Can you find the trends?
If you couldn't find the trends then here are some very basic trend lines. Just by following these trend lines you would have an idea of when a good time to invest into Ripple would be. Obviously this is just a beginners guide and more factors come into the overall decision to invest.
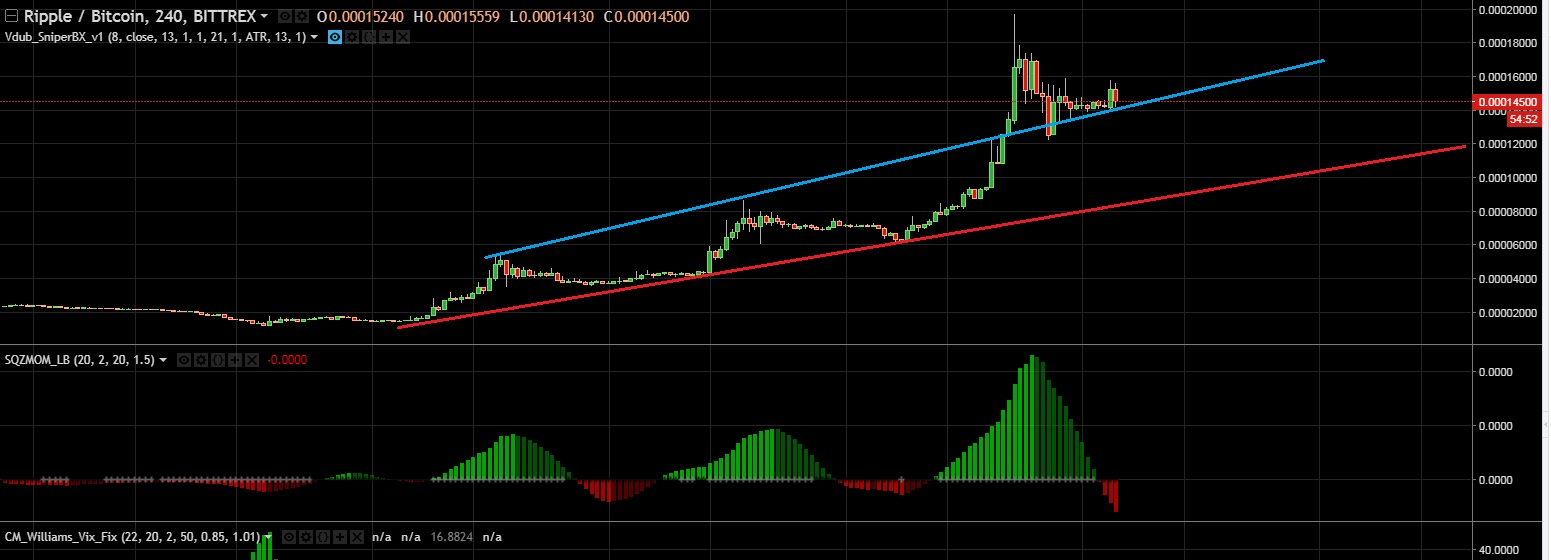
As you can tell the currency followed the red line pretty well until in jumped to the next stage, a savvy investor would have bought at the beginning of the trend but instead of selling at the peaks would have simply purchased additional coins near the bottom of each dip.
Several Different Trend Patterns and What They Are
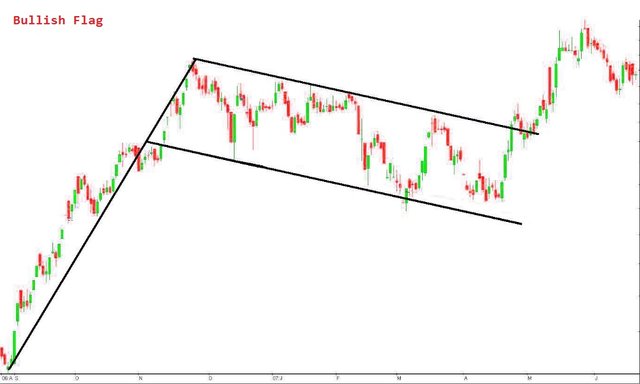
The Bull Flag
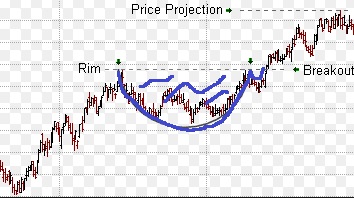
The Cup and Handle
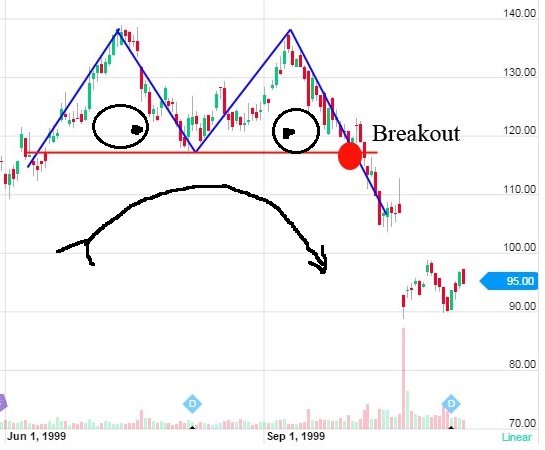
The Double Peak
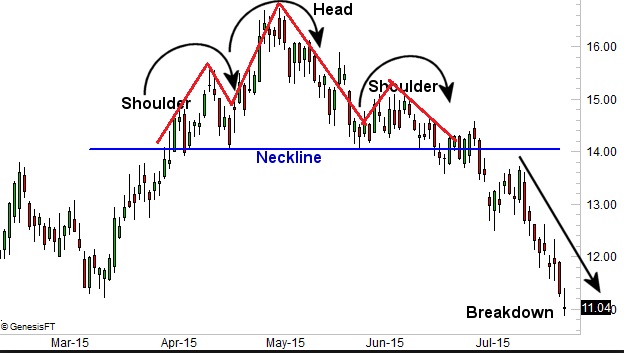
The Head and Shoulders
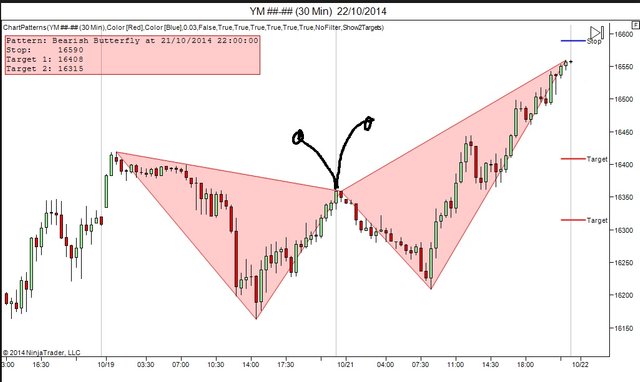
The Butterfly
