报告主编:臧志彭教授 华东政法大学;解学芳教授 同济大学
Professor Zang Zhipeng East China University of Political Science and Law;
Professor Xie Xuefang Tongji University
《全球报告》根据国际三大产业分类标准——标准产业分类体系(SIC)、北美产业分类系统(NAICS)和全球产业分类标准(GICS)构建统一的文化创意产业统计范畴和全球统一评价体系,从国际权威上市公司数据库搜集整理了1950年至2016年间全球53个国家文化创意产业上市公司数据上百万条(数据检索截至2017年12月),形成了1950年以来全球文化创意产业演化生命周期、全球文化创意产业上市公司龙文化指数100强、“一带一路”文化创意产业发展演化与竞争格局、全球文化创意产业上市公司研发投入、全球文化创意产业上市公司纳税能力研究等一系列研究成果,对全球主要国家,特别是中国文化创意产业发展的竞争格局、优势差距、结构特征与演化态势等进行了系统研究和深刻解析。
The "Global Report" builds a unified cultural and creative industry statistical category and a global unified evaluation system based on the three major international industry classification standards-Standard Industry Classification System (SIC), North American Industry Classification System (NAICS) and Global Industry Classification Standard (GICS), Collected from the international authoritative listed company database over a million pieces of data on cultural and creative industries listed companies in 53 countries around the world from 1950 to 2016 (data retrieval as of December 2017), forming the evolutionary life cycle of the global cultural and creative industries since 1950 , Global cultural and creative industry listed company Dragon Culture Index 100, "One Belt One Road" cultural creative industry development evolution and competition pattern, global cultural and creative industry listed company R&D investment, global cultural and creative industry listed company taxation capacity research and other series of research results.This paper systematically studies and profoundly analyzes the competition pattern, advantage gap, structural characteristics and evolution trend of cultural and creative industries in major countries in the world, especially in China.
1950年以来全球文化创意产业演化生命周期研究发现
Research findings on the evolutionary life cycle of global cultural and creative industries since 1950
基于产业经济学上经典的G-K产业生命周期模型(包括引入期、大量进入期、稳定期、大量退出期和成熟期五个阶段)理论,对长达67年(1950~2016年)全球文化创意产业上市公司数量演化曲线分析发现,全球文化创意产业经过两次世界大战的洗礼,从1950年开始逐渐恢复和长足发展,文化创意产业细分行业类别从14类快速发展裂变至110类,产业规模不断扩大、产业结构日益完善,产业优势越发凸显:
Based on the classic GK industry life cycle model in industrial economics (including five stages: introduction period, large-scale entry period, stable period, large-scale exit period, and mature period) theory, it has been used for 67 years (1950~2016) of global cultural creativity The analysis of the evolution curve of the number of listed companies in the industry found that the global cultural and creative industry has gradually recovered and developed rapidly since 1950 after the baptism of the two world wars. The sub-industry category of the cultural and creative industry has rapidly developed and fissioned from 14 categories to 110 categories. With continuous expansion and ever-improving industrial structure, the industrial advantages are becoming more prominent:
(1)1950~1986年是全球文化创意产业生命周期的“恢复发展期”(类似于新产业的“引入期”),全球文化创意产业上市公司年均增长数量为24.42家,到1986年逐渐增加到951家;1987~1999年是全球文化创意产业的“大量进入期”生命周期阶段,1987年首次突破1000家,到1999年底增长到3540家,增长率为330%,年均增长206家,成为典型的“黄金十年”增长期;2000年至今,全球文化创意产业基本进入生命周期的“稳定期”发展阶段,全球文化创意产业上市公司数量从2000年3587家增加到2012年的历史最高峰值4074家(期间经历互联网泡沫破灭和全球金融危机短暂回调),增长速度明显减缓,年均增长率仅为1.1%,而2012年之后出现小幅下滑。从2000年至今的总体形态来看,基本处于比较平稳发展的态势,属于典型的稳定期特征。
From 1950 to 1986 was the "recovery development period" of the life cycle of the global cultural and creative industry (similar to the "introduction period" of new industries). The average annual growth of listed companies in the global cultural and creative industry was 24.42, which gradually increased to 951 in 1986. The period from 1987 to 1999 was the "mass entry phase" life cycle stage of the global cultural and creative industry. In 1987, it exceeded 1,000 for the first time, and it increased to 3,540 by the end of 1999, with a growth rate of 330% and an average annual increase of 206, becoming a typical "Golden Decade" growth period;Since 2000, the global cultural and creative industry has basically entered the "stabilization period" of the life cycle. The number of listed companies in the global cultural and creative industry has increased from 3,587 in 2000 to the historical peak of 4,074 in 2012 (during the period when the Internet bubble burst and global The financial crisis pulled back briefly), the growth rate has slowed down significantly, with an average annual growth rate of only 1.1%, and a slight decline after 2012.Judging from the overall situation from 2000 to the present, it is basically in a relatively stable development situation, which is a typical stable period.
(2)全球文化创意产业上市公司洲际分布集中在亚洲、北美洲、欧洲;从8大强国文化创意产业生命周期来看,美国:1999年以前“口红效应”明显,经过10年“退出期”,2010年企稳正向“成熟期”过渡;英国:2005年以前持续攀升,之后进入“退出期”,2012年有向“成熟期”过渡迹象;法国:2000年以前“大量进入期”,之后进入“稳定期”,2012年后进入平缓“退出期”;德国:2000年达到峰值,之后进入两阶段“稳定期”,2012年后进入平缓“退出期”;日本:2006年达到峰值,目前仍处于“稳定期”;韩国:虽受金融危机影响波动,总体仍然处于“进入期”;印度:2010年达到峰值,目前处于“稳定期”生命周期阶段;中国:目前处于“大量进入期”向“稳定期”过渡阶段。
The intercontinental distribution of listed companies in the global cultural and creative industries are concentrated in Asia, North America, and Europe;From the perspective of the life cycle of the cultural and creative industries of the eight major powers, the United States: The "lipstick effect" was obvious before 1999, and after a 10-year "exit period", the stability in 2010 was transitioning to the "mature period"; the United Kingdom: continued to rise before 2005, After that, it entered the "exit period", and there were signs of transition to the "mature period" in 2012; France: "a large number of entry periods" before 2000, then a "stability period", and a gentle "exit period" after 2012; Germany: 2000 After reaching the peak, it will enter a two-stage "stability period", and after 2012, it will enter a gentle "exit period"; Japan: peaked in 2006 and is still in the "stability period"; South Korea: Although affected by the financial crisis and fluctuating, the overall situation is still Entry period"; India: reached its peak in 2010 and is currently in the "stabilization period" life cycle stage; China: currently in the transitional stage of the "mass entry period" to the "stability period".
(3) 从6个核心文化创意行业生命周期来看,新闻出版行业:总体开始进入“大量退出期”阶段;电影行业:经历两阶段快速发展,正由“稳定期”向“退出期”变迁;广播电视行业:经历20多年高速发展,2011年后开始进入“退出”期;网络文化行业:经历两次跃迁,目前基本处于“稳定期”阶段;广告服务行业:数量和比重持续上升,2014年后进入“稳定期”;家庭娱乐行业:90年代爆发式增长,经大量退出后进入“成熟期”生命阶段。
From the perspective of the life cycles of the six core cultural and creative industries, the press and publishing industry: as a whole began to enter the "mass exit period"; the film industry: experienced two stages of rapid development, and is changing from the "stability period" to the "exit period"; radio and television Industry: After more than 20 years of rapid development, it has entered the "exit" period after 2011; the network culture industry: has undergone two transitions, and is currently basically in the "stability period" stage; advertising service industry: the number and proportion continue to rise, entering after 2014 "Stabilization period"; home entertainment industry: explosive growth in the 1990s, after a large number of withdrawals, it entered the "mature period" life stage.
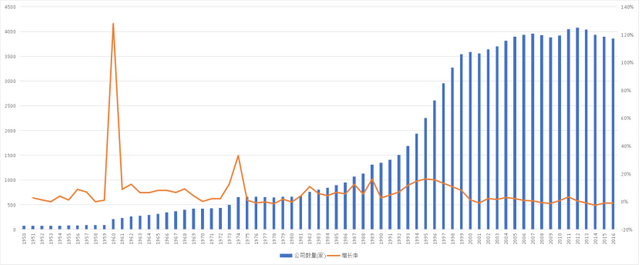
图1 1950-2016年全球文化创意产业上市公司数量总体演化态势
Figure 1 Overall evolution trend of the number of listed companies in the global cultural and creative industry from 1950 to 2016
全球文化创意产业上市公司龙文化指数100强研究发现
Research findings on the Dragon Culture Index Top 100 Listed Companies in the Global Cultural and Creative Industries
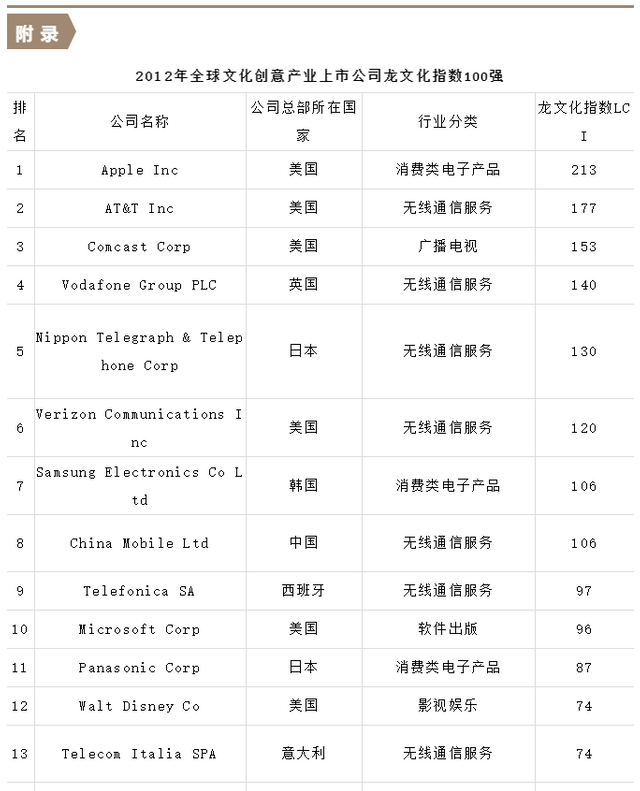
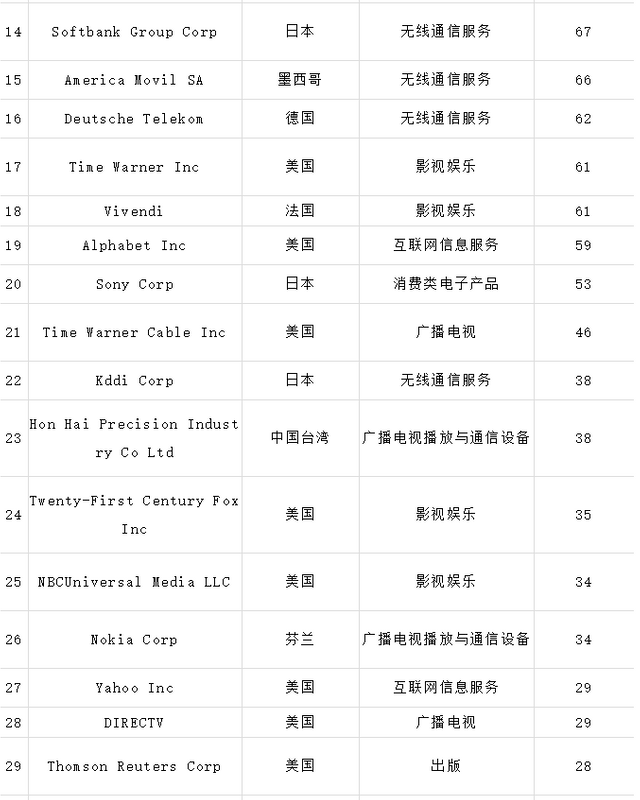
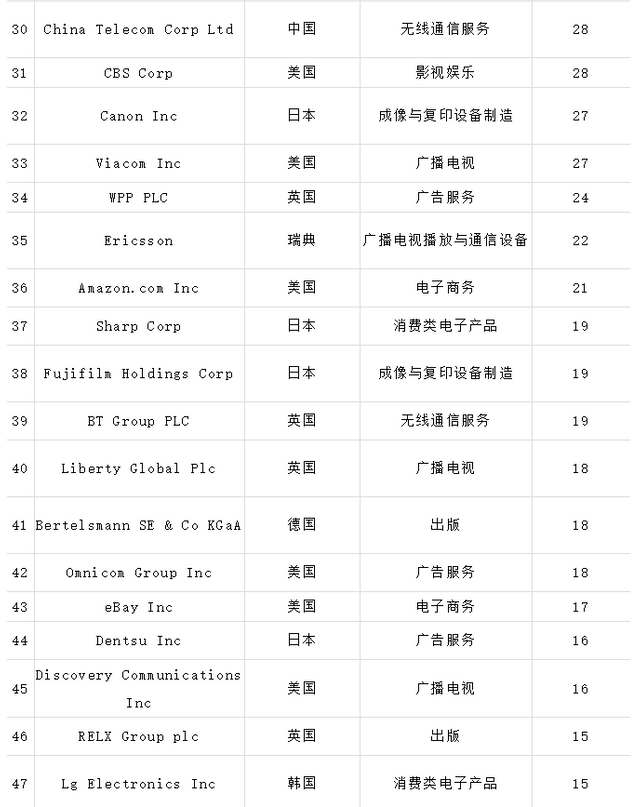
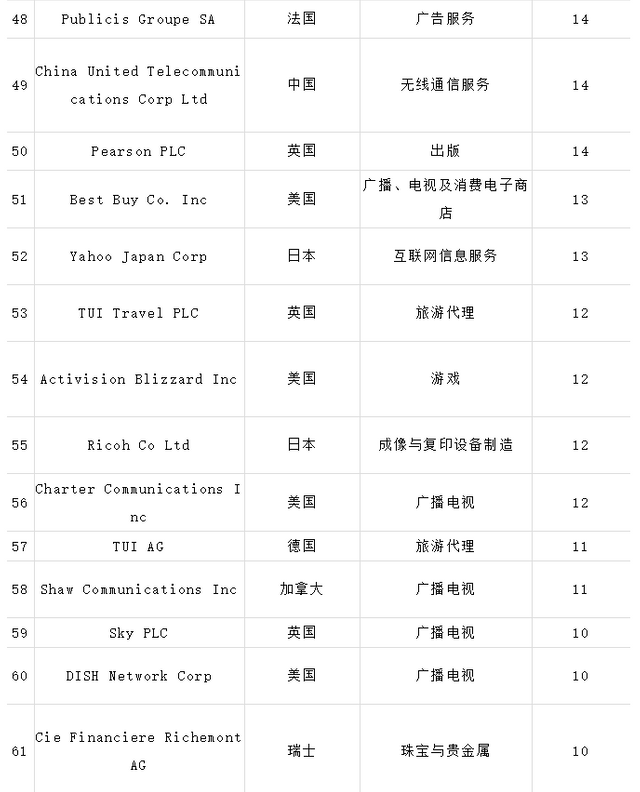
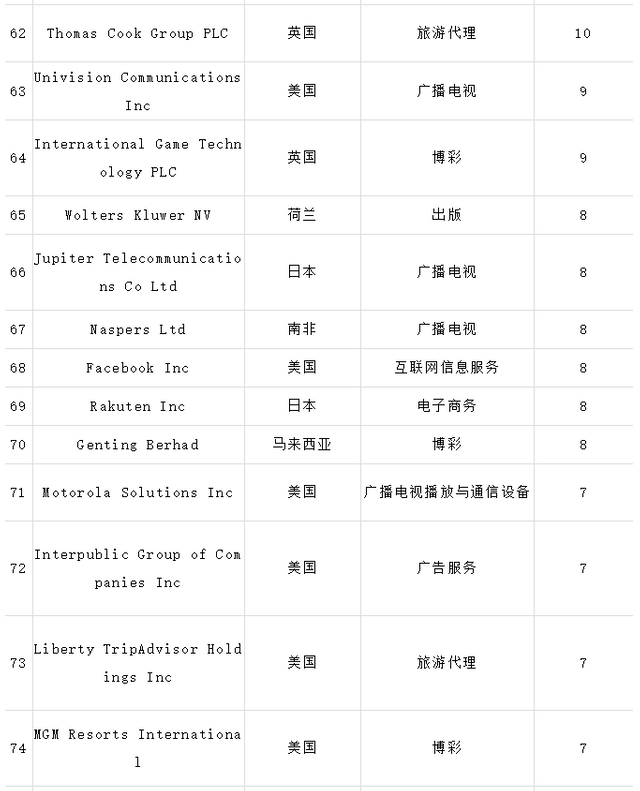
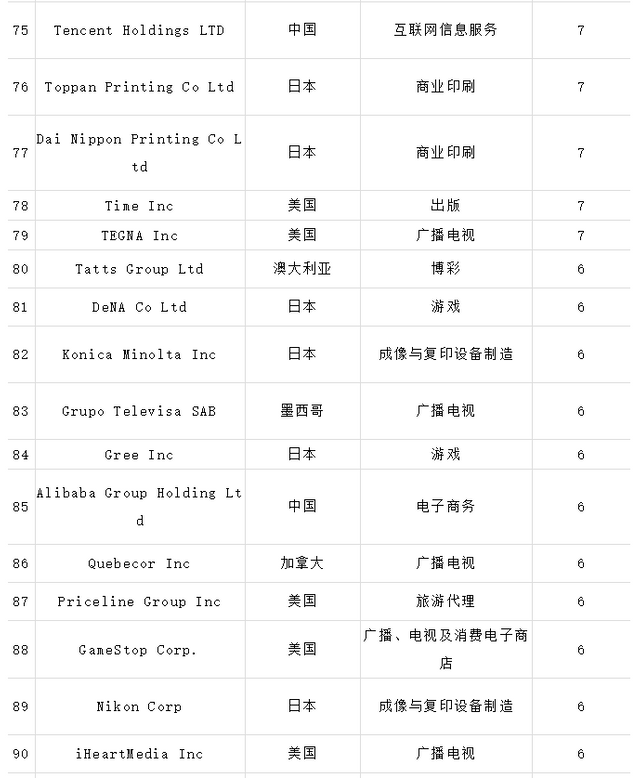
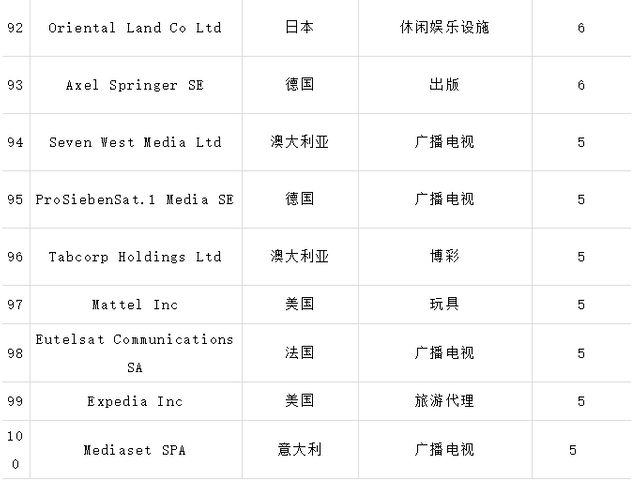
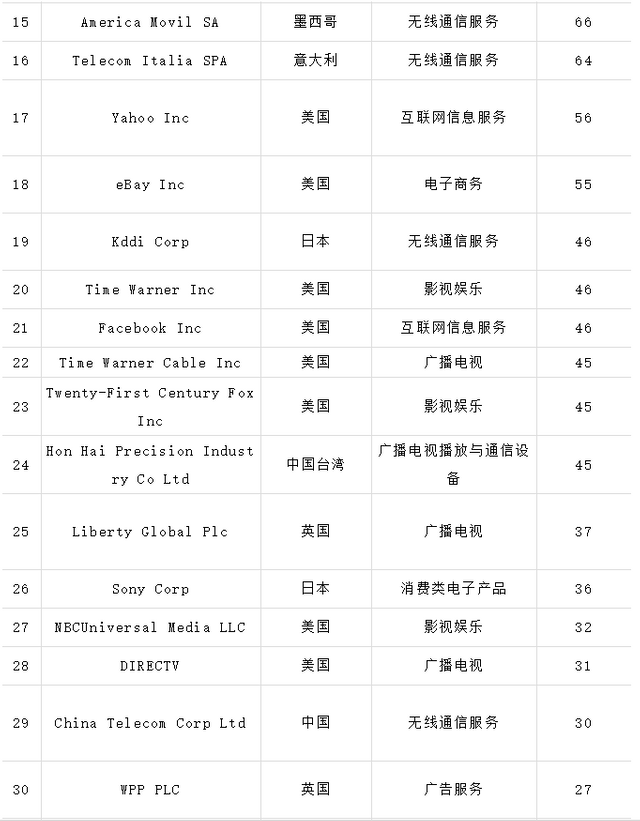
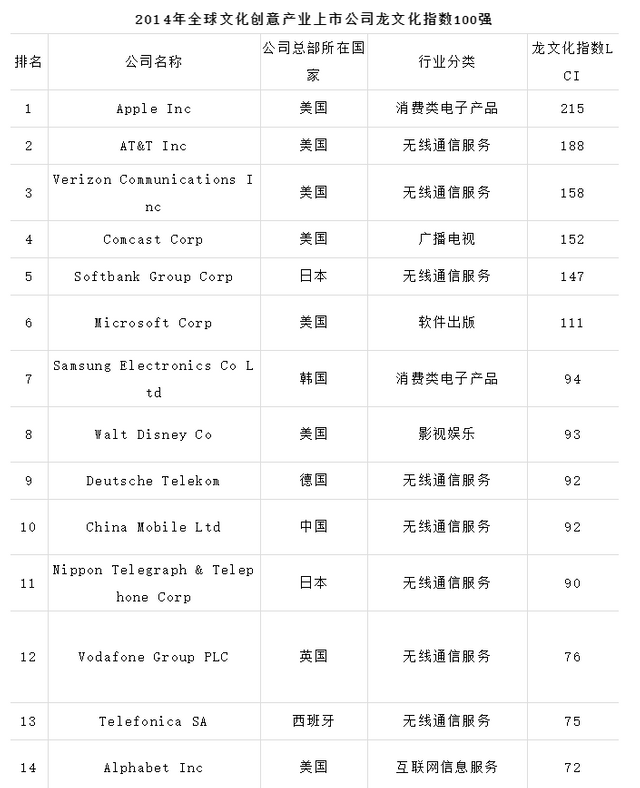
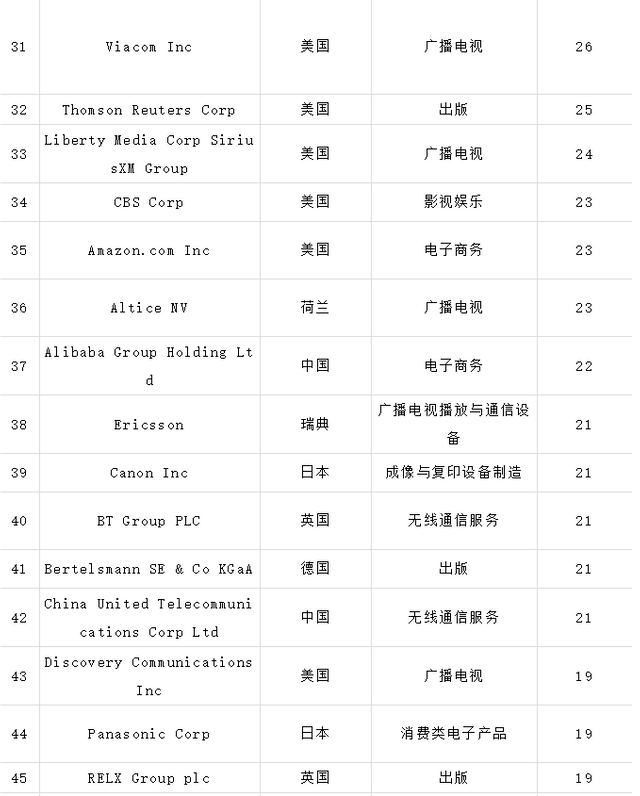
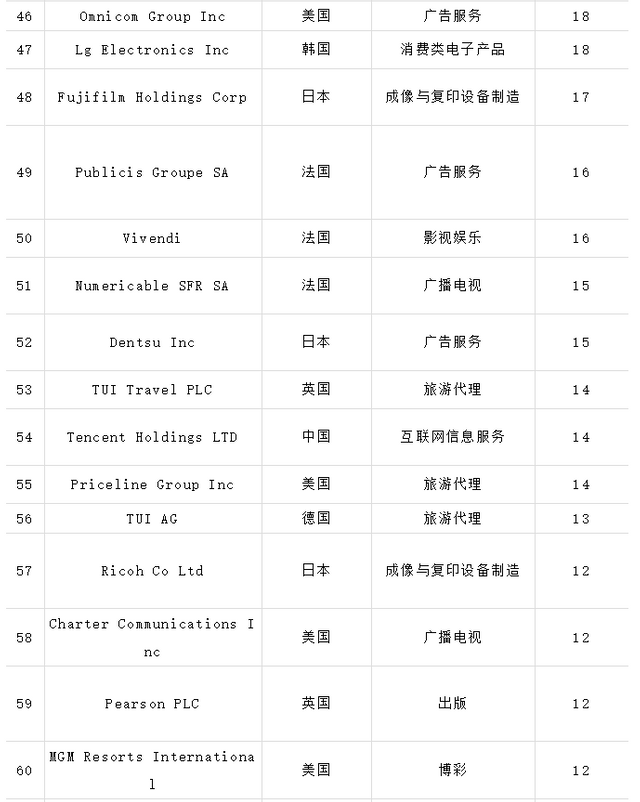
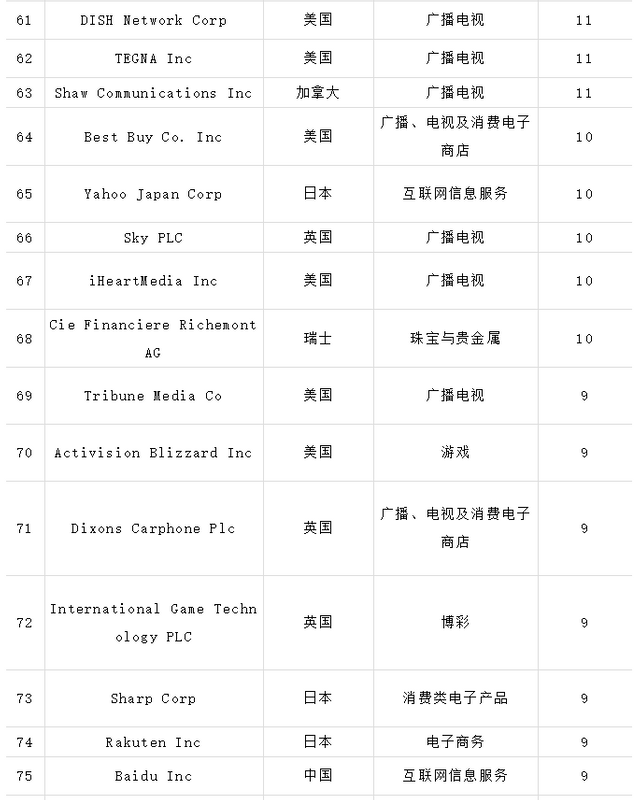
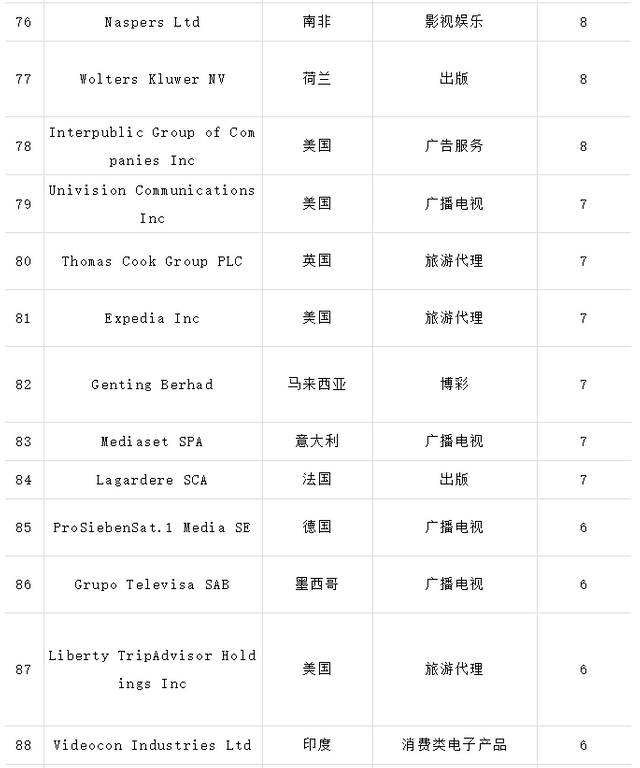
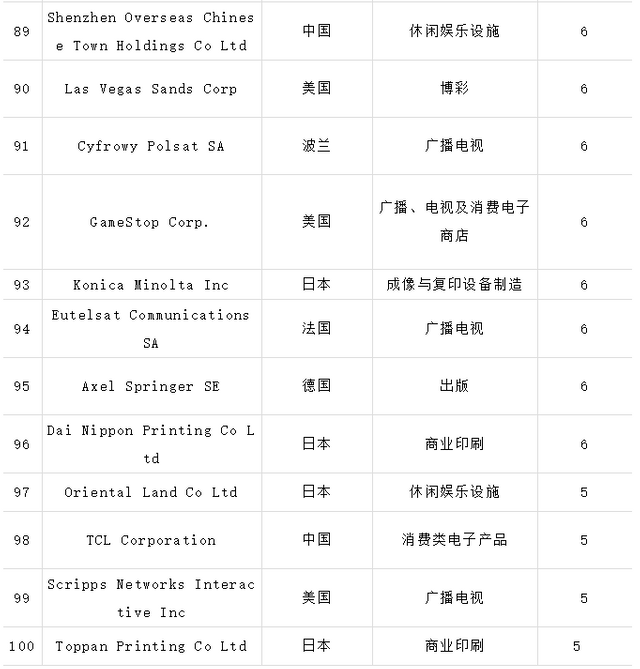
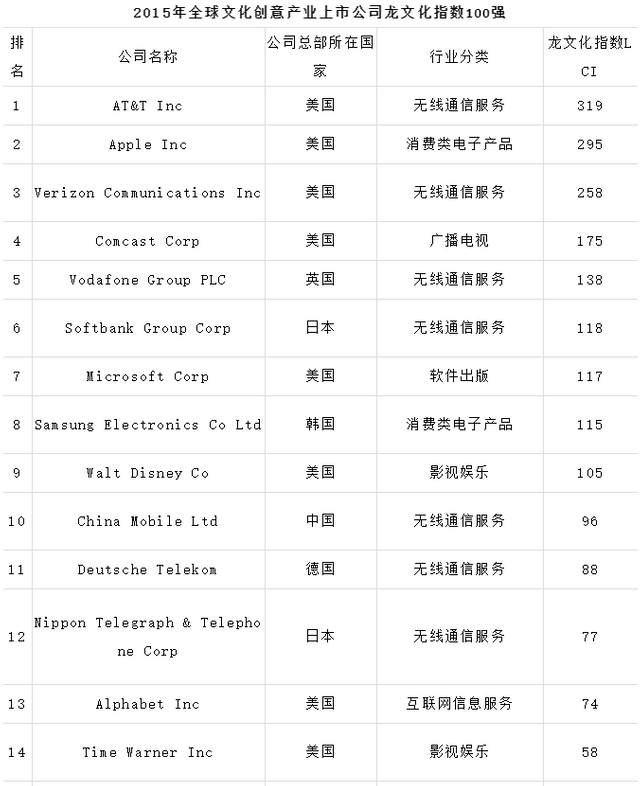
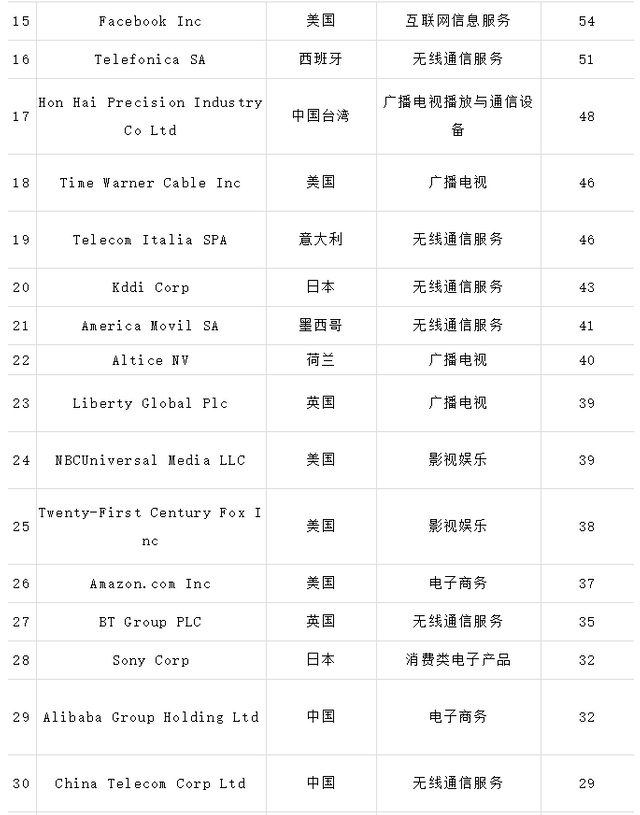
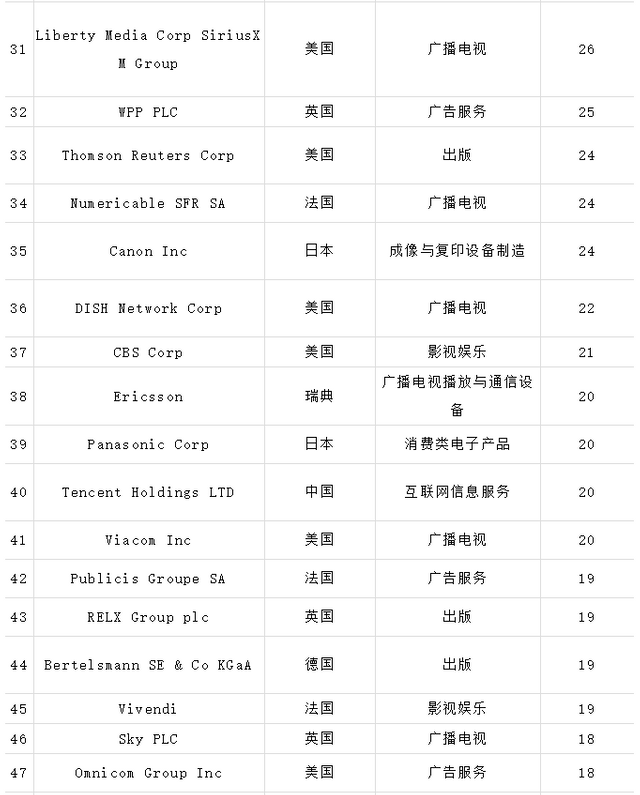
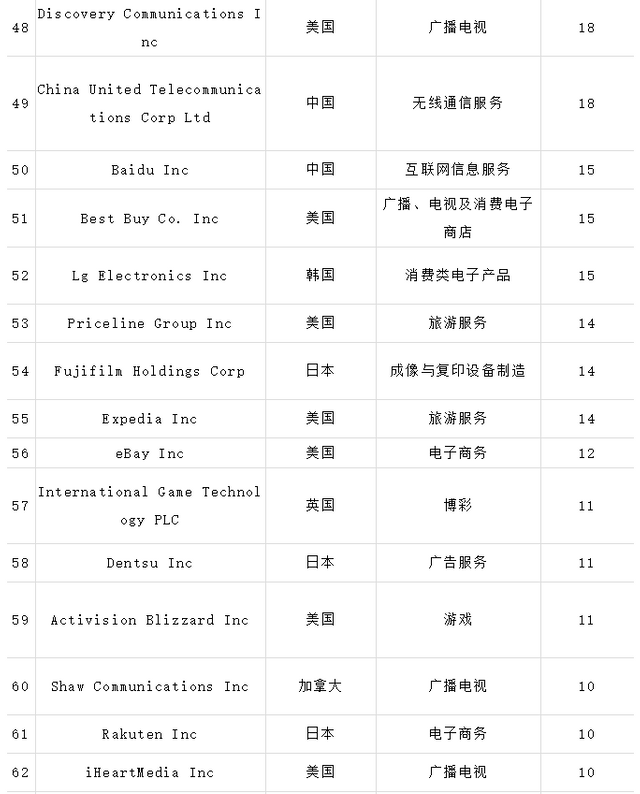
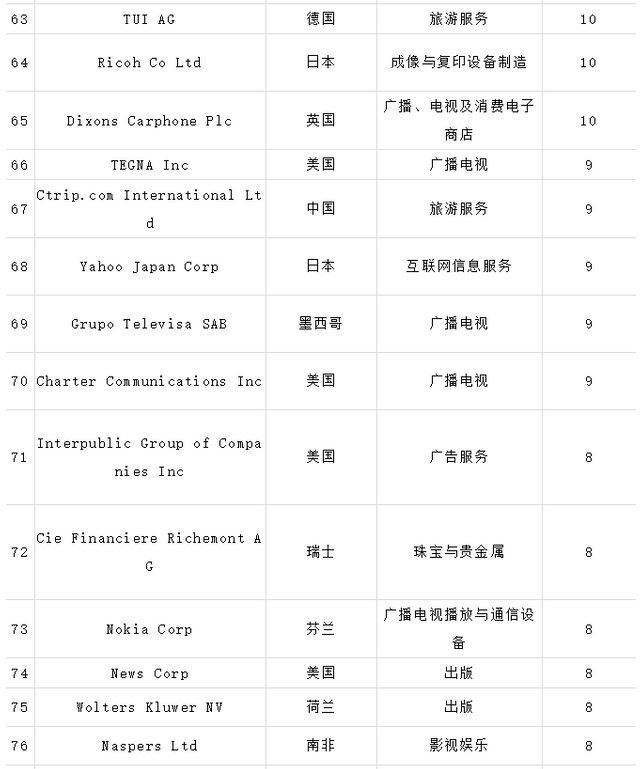
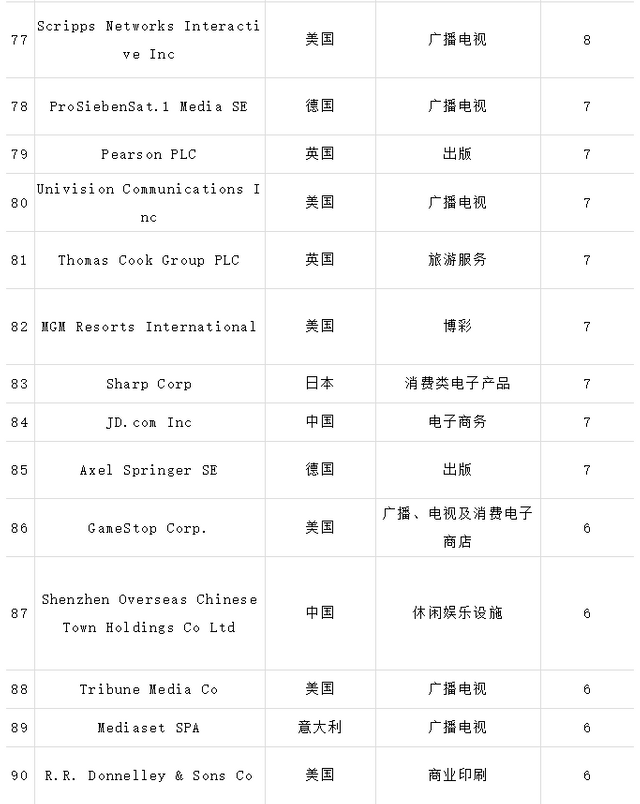
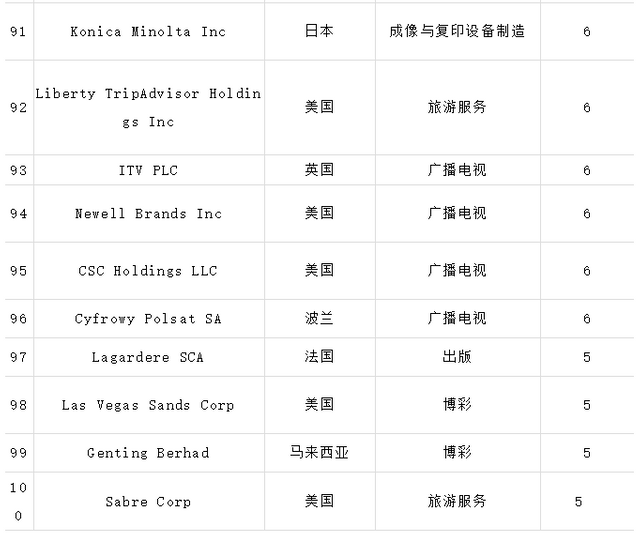
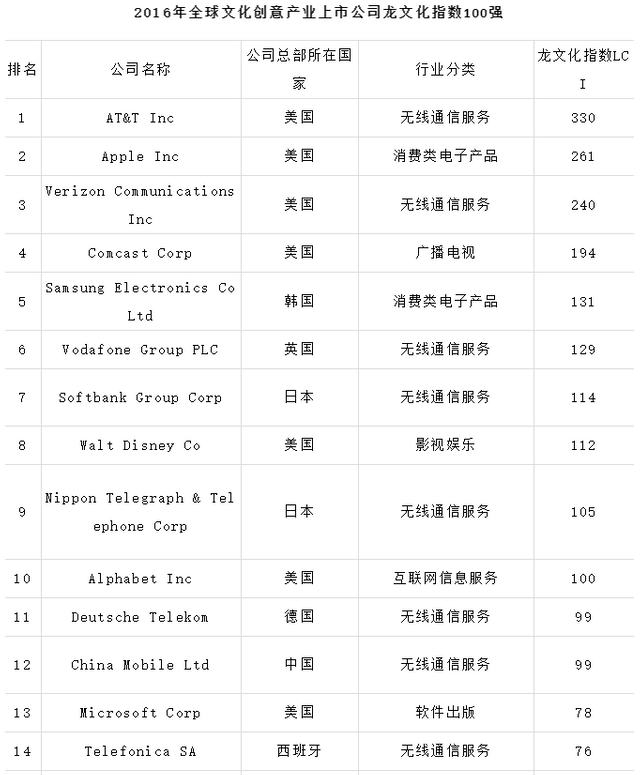
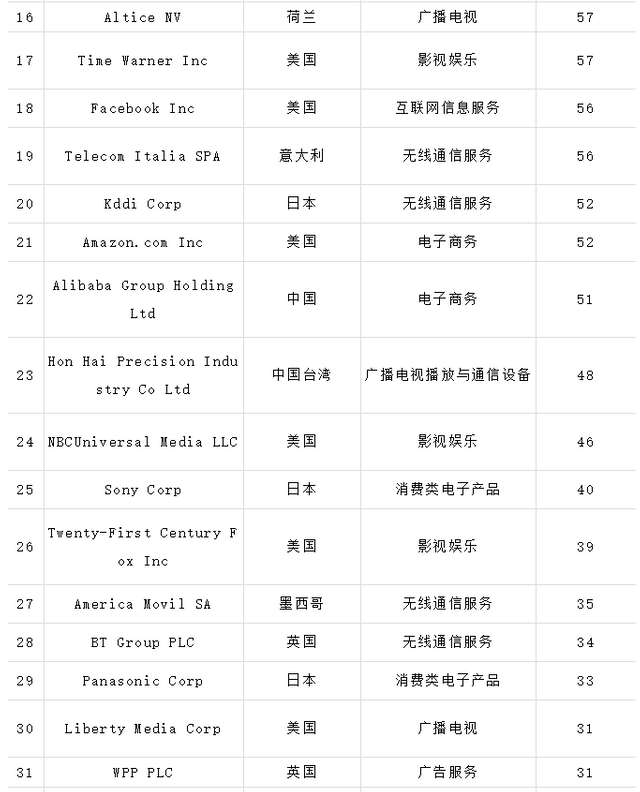
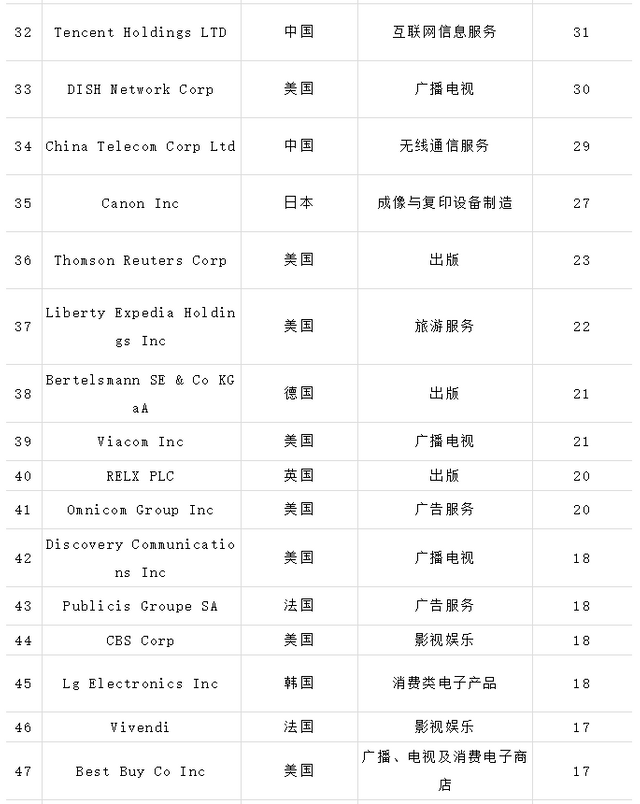
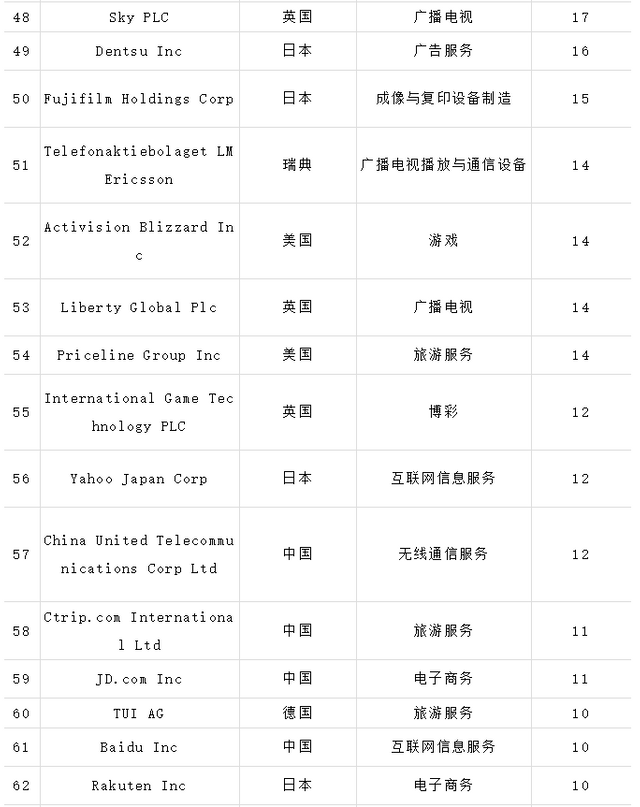
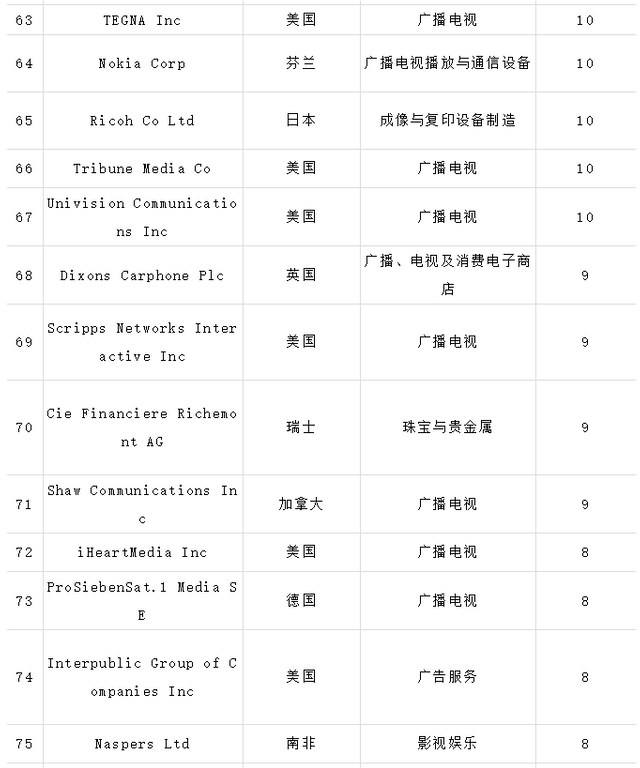
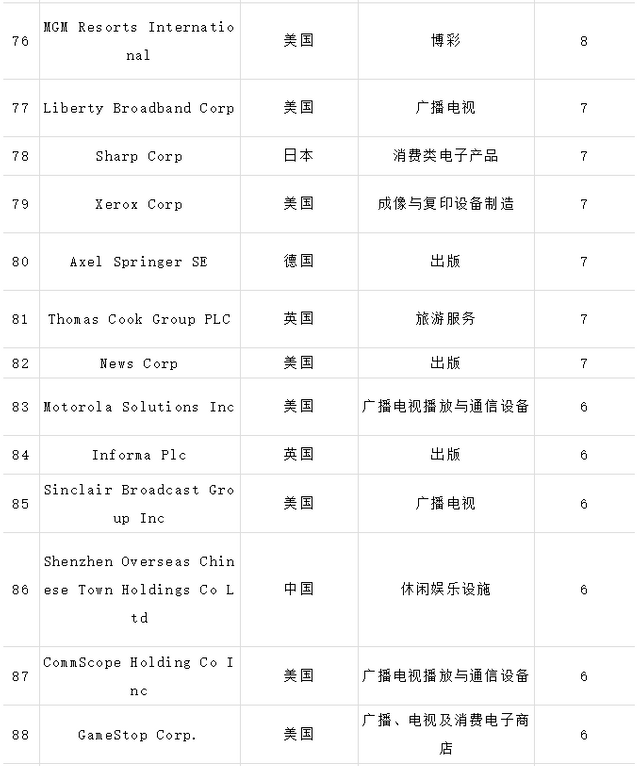
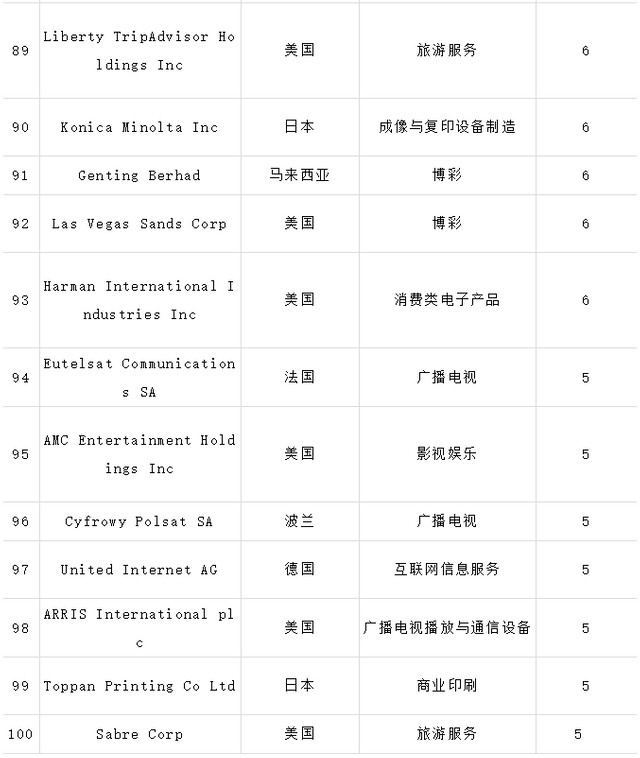
基于全球统一行业划分标准与统一数据来源,构建经济效益、创意创新和社会贡献三位一体的全球文化创意产业上市公司“龙文化指数”综合评价体系,通过量化统计分析,形成2012~2016年全球文化创意产业上市公司龙文化指数100强排行榜单和全球文化创意产业发展格局研判:
Based on a unified global industry classification standard and a unified data source, a comprehensive evaluation system of the "Dragon Culture Index" for listed companies in the global cultural and creative industry is constructed with a trinity of economic benefits, creative innovation and social contribution. Through quantitative statistical analysis, the global cultural creativity from 2012 to 2016 is formed The list of the top 100 listed companies in the Dragon Culture Index and the research and judgment on the development pattern of the global cultural and creative industry:
(1)美国Apple公司和AT&T公司轮番占据榜首,美国康卡斯特(Comcast Corp)、微软公司(Microsoft Corp)、迪士尼(Walt Disney Co)、Alphabet(谷歌母公司)、脸书公司(Facebook Inc)、亚马逊(Amazon.com Inc),韩国三星集团、日本索尼公司等知名巨头盘踞百强前列。
American Apple and AT&T took turns occupying the top spot, with Comcast Corp, Microsoft Corp, Walt Disney Co, Alphabet (Google parent company), Facebook Inc, Amazon (Amazon.com Inc), South Korea's Samsung Group, Japan's Sony Corporation and other well-known giants are among the top 100.
(2)广播电视业入围百强数量超过20家、领先优势明显;但互联网服务产业链入围百强数量合计有30家(包括上游无线通信服务、中下游的互联网信息服务、旅游服务、在线游戏以及电子商务),对广播电视业已成合围之势;无线通信服务大举战略转型媒体、内容和娱乐领域,已成数字创意产业新霸主;影视娱乐数量震荡、业绩多下滑,出版行业维持乏力;美国连续5年称霸百强,且有不断增强趋势,美国超级巨头在全球范围内构建数字创意全球价值链体系,形成对世界市场巨大的“虹吸效应”。
The radio and television industry has more than 20 finalists in the top 100, and the leading advantage is obvious; but the Internet service industry chain has a total of 30 finalists (including upstream wireless communication services, middle and downstream Internet information services, travel services, online games, and e-commerce). ), the radio and television industry has become a trend; wireless communication services have undergone a major strategic transformation in the media, content, and entertainment fields, and have become the new hegemon of the digital creative industry; the number of film and television entertainment has fluctuated, the performance has fallen, and the publishing industry has remained weak; the United States has remained weak for 5 consecutive years Dominating the top 100, and with a growing trend, American super giants are building a digital creative global value chain system on a global scale, forming a huge "siphon effect" on the world market.
(3)中国文化创意产业上市公司龙文化指数排名全球第7,百强排名虽然全球第4,但数量依然太少,2016年也仅有9家公司入围,仅占美国入围公司数量的20.93%;中国文化创意产业巨头的营业收入几乎100%都来自于中国本土市场,海外收入占比极低,缺少能够撼动世界市场的超级影响力企业;中国入围百强企业基本都集中在无线通信服务、互联网等文化创意产业价值链传输分发与销售等中下游环节,在文化创意产业核心的内容生产环节则无一入围,与世界传统文化强国仍然还有很大的差距。
The Chinese cultural and creative industry listed company Dragon Culture Index ranks 7th in the world. Although the top 100 ranks 4th in the world, the number is still too small. In 2016, only 9 companies were shortlisted, accounting for only 20.93% of the number of US shortlisted companies; Almost 100% of the operating income of the creative industry giants comes from the Chinese local market, and the proportion of overseas income is extremely low, and there is a lack of super influential companies that can shake the world market; China's top 100 companies are basically concentrated in wireless communication services, Internet and other cultures In the middle and lower reaches of the creative industry value chain transmission, distribution and sales, none of the content production links in the core of the cultural and creative industry are shortlisted, and there is still a big gap with the world's traditional cultural powers.
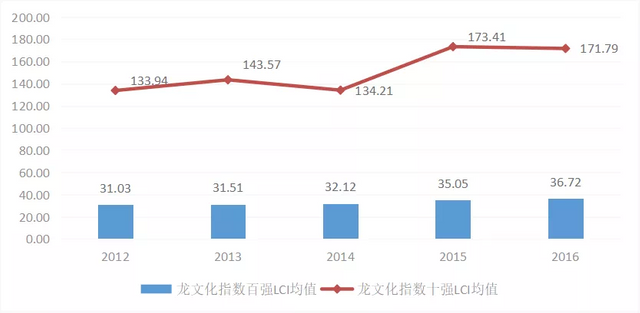
图2 2012-2016年龙文化指数百强与十强均值变化
Figure 2 The average change of the top 100 and top 10 Dragon Culture Index from 2012 to 2016
“一带一路”文化创意产业发展演化与竞争格局研究发现
Research findings on the evolution and competition pattern of cultural and creative industries along the “Belt and Road”
(1)相对于发达国家,“一带一路”沿线国家和地区的文化创意产业普遍起步较晚,但90年代以来文创上市公司总量增速较大,成长较快,正逐步缩小与发达国家的差距,2000年“一带一路”文化创意产业上市公司占全球比重提高至14.16%,2008年达到24.94%,2012年达到峰值1062家(占26.07%),此后增长逐渐放缓,但始终维持着近25%的占比。从2013年以来“一带一路”沿线国家和地区文化创意产业发展进入产业生命周期的“稳定期”阶段。
Compared with developed countries, the cultural and creative industries of countries and regions along the “Belt and Road” generally started late, but since the 1990s, the total number of listed cultural and creative companies has grown rapidly, and is gradually narrowing the gap with developed countries. In 2000, the proportion of listed companies in the “Belt and Road” cultural and creative industries in the world increased to 14.16%, reached 24.94% in 2008, and reached a peak of 1062 (26.07%) in 2012. Since then, the growth has gradually slowed down, but it has maintained nearly 25%. % Of. Since 2013, the development of cultural and creative industries in countries and regions along the "Belt and Road" has entered the "stability period" stage of the industrial life cycle.
(2)从地理分布区域来看,“一带一路”沿线国家和地区文化创意产业分布不均,国家差距悬殊,整体结构配置亟待改善。
From the perspective of geographical distribution, the cultural and creative industries in the countries and regions along the “Belt and Road” are unevenly distributed, and there is a wide gap between countries, and the overall structural configuration needs to be improved urgently.
(3) 从2012~2016年龙文化指数均值排名来看,中国是当仁不让的领头羊,每年稳定在第一位,且龙文化指数长期保持领先,并有扩大优势(这里不含日本、韩国);前5强排名有固化趋势,希腊、马来西亚、印度尼西亚名列前茅;东亚区域遥遥领先,东南亚区域发展势头良好,但西亚、南亚及中东欧区域目前发展落于下风;有7个国家的总资产利润率出现负值,表明“一带一路”文化创意企业资产盈利能力尚不成熟。
Judging from the average ranking of the Dragon Culture Index from 2012 to 2016, China is the leader in doing our part, stabilizing at the first place every year, and the Dragon Culture Index has maintained a leading position for a long time, and has the advantage of expansion (excluding Japan and South Korea here); the top 5 Strong rankings tend to solidify, with Greece, Malaysia, and Indonesia topping the list; East Asia is far ahead, and Southeast Asia has a good momentum of development, but West Asia, South Asia and Central and Eastern Europe are currently at a disadvantage; 7 countries have negative returns on total assets , Indicating that the profitability of the assets of cultural and creative enterprises in the “Belt and Road” initiative is not yet mature.
(4) 从“一带一路”与全球文创产业百强企业差距演化分析发现,2012~2016年间“一带一路”入围全球文化创意产业上市公司龙文化指数百强的企业数量整体呈下降趋势,文创上市公司综合实力与世界100强平均水平之间存在较大差距,且差距呈逐渐扩大趋势。
From the analysis of the evolution of the gap between the “Belt and Road” and the top 100 global cultural and creative industries, it is found that from 2012 to 2016, the number of companies in the “Belt and Road” listed on the Dragon Culture Index of global cultural and creative industries has shown an overall downward trend. There is a big gap between the company's comprehensive strength and the average level of the world's top 100, and the gap is gradually expanding.
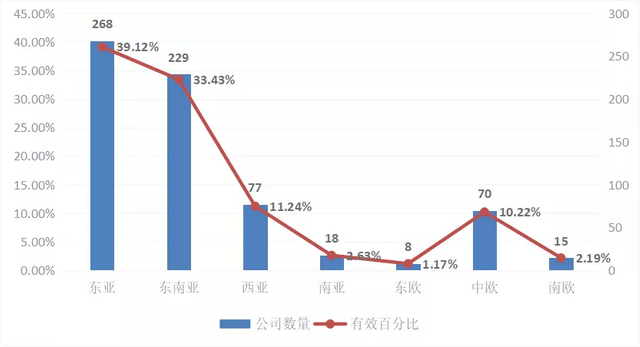
图3 “一带一路”各区域文化创意产业上市公司数量及比重演化
Figure 3 Evolution of the number and proportion of listed companies in cultural and creative industries in each region of the "Belt and Road"
全球文化创意产业上市公司研发投入研究发现
Research findings on R&D investment of listed companies in the global cultural and creative industries
(1)总体来看,全球文化创意产业上市公司研发投入呈现上升趋势,据不完全统计(仅包含披露相关数据的上市公司),2016年全球文化创意产业上市公司研发投入均值达到6.99亿元人民币,比2012年均值5.31亿元增长了31.64%;研发费用占比从2012年的7.26%上升到8.48%。
On the whole, the R&D investment of listed companies in the global cultural and creative industries is showing an upward trend. According to incomplete statistics (including only listed companies that disclose relevant data), the average R&D investment of listed companies in the global cultural and creative industries reached 699 million yuan in 2016, compared with 2012 The annual average value of 531 million yuan increased by 31.64%; the proportion of research and development expenses rose from 7.26% in 2012 to 8.48%.
(2) 从全球文化创意产业上市公司研发投入百强榜单来看,百强企业“三大梯队”特征明显,第一梯队的文化创意产业上市公司研发费用在100亿元人民币以上,有11家企业入选,最高的是Amazon,达1068.75亿元人民币;第二梯队研发费用在10亿~100亿元人民币,有54家企业;第三梯队的研发投入在10亿元人民币以下,有35家。百强企业在国家和行业分布等方面具有明显的不均衡性,美国入围48家,遥遥领先其他国家或地区;26家企业属于文化软件和服务行业,10强中,互联网服务和通信设备行业的企业“势均力敌”,各有3家。百强企业分布区域呈现先扩散后集中趋势,表明文化市场竞争态势加剧。
Judging from the list of the top 100 global cultural and creative industry listed companies for R&D investment, the characteristics of the "three echelons" of the top 100 companies are obvious. The first echelon of cultural and creative industry listed companies has R&D expenses of more than 10 billion yuan, and 11 companies have been selected. , The highest is Amazon, reaching 106.875 billion yuan; the second-tier R&D expenditure is 1 billion to 10 billion yuan, with 54 companies; the third-tier R&D investment is less than 1 billion yuan, with 35 companies. The top 100 companies have obvious imbalances in the distribution of countries and industries. The United States is shortlisted for 48 companies, far ahead of other countries or regions; 26 companies belong to the cultural software and service industry, and among the top 10, the Internet service and communication equipment industry The companies are "evenly matched", with three each. The distribution areas of the top 100 companies show a tendency to spread first and then concentrate, indicating that the competition in the cultural market has intensified.
(3)全球文化创意产业上市公司研发投入占比均值差异大,欧美研发投入占比高,加拿大和美国文化创意产业上市公司研发投入占比均值最高,分别为16.73%和11.45%;亚洲研发投入严重不足,中国每年入围全球文创研发投入百强的企业数量维持在9~11家,但研发投入占比均值仅为8.39%,与发达国家相比仍有很大提升空间。文化创意产业上市公司研发投入更多应是致力于挖掘潜在的创造力与文化内容的灵魂、激活静态的文化资源,通过创意创新作用于文化创意生产、传播与销售整个产业链,真正实现文化创意产业最深层次的价值转换。
The average R&D investment of listed companies in the global cultural and creative industries differs greatly. Europe and the United States account for high R&D investment. Canada and the United States have the highest average R&D investment in cultural and creative industries, 16.73% and 11.45% respectively; Asia’s R&D investment is seriously insufficient. The number of China's top 100 global cultural and creative R&D investment enterprises is maintained at 9-11 each year, but the average R&D investment ratio is only 8.39%, and there is still much room for improvement compared with developed countries. Listed companies in the cultural and creative industry should invest more in research and development to tap the soul of potential creativity and cultural content, activate static cultural resources, and act on the entire industrial chain of cultural creative production, dissemination and sales through creative innovation, so as to truly realize cultural creativity The deepest value conversion of the industry.
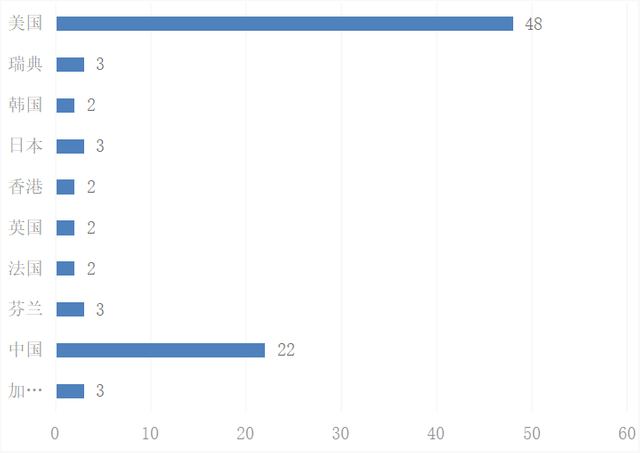
图4 全球文化创意产业上市公司研发投入总额100强国家分布
Figure 4 Distribution of the top 100 countries with total R&D investment of listed companies in the global cultural and creative industries
全球文化创意产业上市公司纳税能力研究发现
Research Findings on Taxation Ability of Listed Companies in Global Cultural and Creative Industries
(1)美国、日本、英国、中国、德国、法国、韩国等七个国家雄踞全球文化创意产业纳税能力百强榜席位83.8%,美国中国韩国增势明显、日本法国呈震荡下行态势。中国从16.56亿元激增到36.06亿元,总增幅达到117%,增速全球第一。
Seven countries, including the United States, Japan, the United Kingdom, China, Germany, France, and South Korea, occupy 83.8% of the top 100 tax-paying countries in the global cultural and creative industries. The United States, China, South Korea, and Japan and France show a shocking downward trend. China surged from 1.656 billion yuan to 3.606 billion yuan, with a total growth rate of 117%, the fastest growth rate in the world.
(2)行业结构渐趋多元,全球文创上市公司纳税能力30强在2012年分布在12个行业,2016年增加到16个行业;互联网及电影类上市公司纳税能力表现突出,五年间平均每年有6家互联网软件与服务上市公司、6.25家电影娱乐上市公司入选30强。
The industry structure has gradually become diversified. The top 30 global cultural and creative listed companies with tax-paying capacity were distributed in 12 industries in 2012 and increased to 16 industries in 2016; Internet and film-listed companies have outstanding taxpaying capacity, with an average of 6 companies each year in five years Internet software and service listed companies and 6.25 movie entertainment listed companies were selected into the top 30.
(3)洲际格局方面,欧洲文创产业纳税能力水平整体最高。国家格局方面:美国入选全球纳税百强公司数量占据49席,稳居首位;13个发达国家的文创上市公司纳税均值为20.32亿元人民币;6个发展中国家和地区纳税均值为17.20亿元人民币;中国大陆以纳税均值36.06亿元成为了发展中国家和地区中纳税最高的一个,而且成为100强纳税均值第2高的国家。行业格局方面:8个行业占据49%席位,其余26个行业占51%。
In terms of the intercontinental structure, the European cultural and creative industries have the highest taxation capacity overall. In terms of national structure: the United States has 49 seats among the top 100 taxpayers in the world, ranking first; the average tax value of listed cultural and creative companies in 13 developed countries is 2.032 billion yuan; the average tax value of 6 developing countries and regions is 1.72 billion yuan RMB: With an average tax value of 3.606 billion yuan, mainland China has become the highest taxpayer among developing countries and regions, and has become the second highest taxpayer among the top 100 countries. In terms of industry structure: 8 industries occupy 49% of the seats, and the remaining 26 industries account for 51%.
(4) 中国地位:2012~2016年中国在五年中有四年分别与法国、德国并列第4,跻身全球文创上市公司纳税七大强国之列,但是入选公司数量却仅有4~5家,远远低于美国的50家、日本辉煌时期的25家,从五年数量占比来看仅占4.4%;中国与日本、英国距离拉近,但中美纳税均值差距五年间虽然减少了55.58亿元人民币,但差距仍高达美国75.48亿元人民币;中国五年来仅有互联网软件与服务1个行业进入30强、仅有3个行业入围百强,各行业纳税能力严重失衡,亟需打造多点支撑且平稳有力的纳税贡献模式。
China's status: From 2012 to 2016, China was tied for fourth place with France and Germany in four of the five years from 2012 to 2016, and ranked among the top seven tax-paying countries for listed cultural and creative companies in the world. However, the number of selected companies was only 4 to 5, far Far below the 50 in the United States and the 25 in Japan’s glorious period, it only accounts for 4.4% in five years. The distance between China, Japan and the United Kingdom has narrowed, but the gap in the average tax payment between China and the United States has decreased by 5.558 billion in five years. RMB, but the gap is still as high as RMB 7.548 billion in the United States; in the past five years, China has only one industry in the Internet software and service industry entered the top 30, and only three industries have been listed in the top 100. The taxation capacity of various industries is seriously imbalanced, and there is an urgent need to build more points. A supportive, stable and powerful tax contribution model.
版权声明:
“文化上市公司”公众号是学术公益开放平台,任何机构和个人都可以在遵守国家知识产权法等相关法律法规情况下免费转载“文化上市公司”公众号的文章,但请务必注明转载文章来源于“文化上市公司”公众号,并请完整注明文章作者及相关出处。对未依此规定转载者,本公众号将保留追究一切法律责任的权利。
Copyright Notice:
The "Cultural Listed Company" official account is an open platform for academic public welfare. Any institution or individual can reprint articles from the "Cultural Listed Company" official account for free while complying with the national intellectual property law and other relevant laws and regulations, but please be sure to indicate the reprinted article It comes from the official account of "Cultural Listed Company", and please indicate the author of the article and the relevant source in full. For those who have not reprinted in accordance with this regulation, this official account will reserve the right to pursue all legal responsibilities.
