
In my previous article, I have explained what Moving Average Convergence Divergence is all about. MACD is a technical indicator used in identifying moving averages that unveil a possible trend that could be bearish or bullish. The major issue of concerns here is how to identify a trend. If you could be able to identify all the possible trends using a MACD indicator, you will make a lot of money from cryptocurrency.
You can use any MACD software and you should make use of default settings. You might be wondering if there are better settings to use, but believe me, there is none. Instead of you searching for the best settings to use, go for knowledge to understand the concept behind MACD in order to hit your trading target. With the default settings of MACD, you are good to go if you know what you are doing.
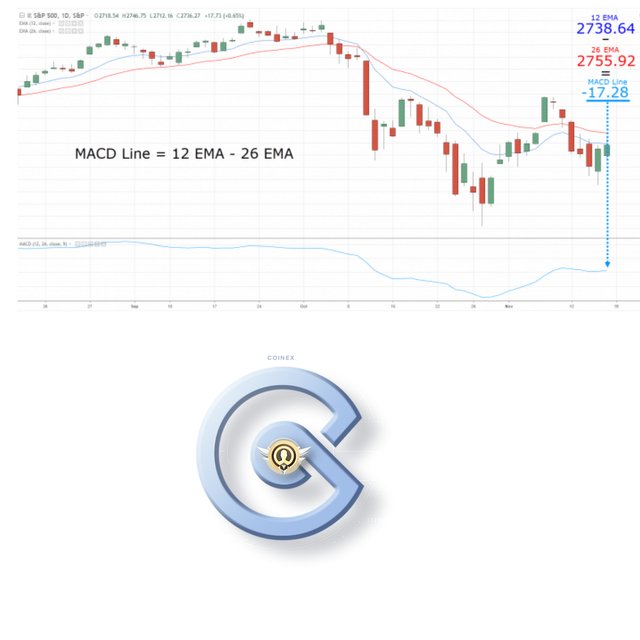
How to Identify the MACD Line
In order to get the MACD line, you will need to subtract the value of the 26-day EMA from the 12-day EMA
MACD line = 12 EMA - 26 EMA
How to Identify the Signal Line
Signal Line is obtained by dividing the MACD line by the total set value of the MACD line.
i.e Let’s say the MACD Line have the following values: 10, 11, 12, 13, 14, 15, 16, 17, 18
Then your Signal line will be 10+11+12+13+14+15+16+17+18 dividend by 9
Signal Line = 126/9
Signal line = 14
So your Signal line is 14.
Remember this is just an example.
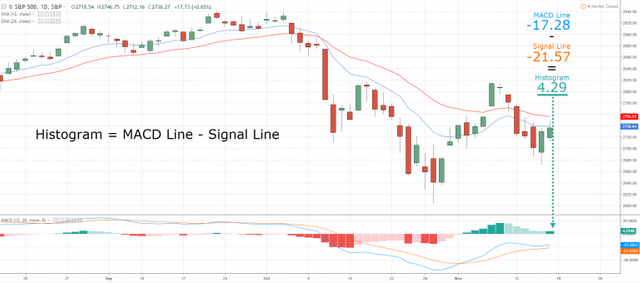
MACD Histogram
To get your Histogram, subtract Signal line from the MACD line
i.e MACD line - Signal line
Therefore,
Histogram = MACD line - Signal line.
SOME MISTAKE WE SHOULD NOTE AND AVOID WHY USING MACD INDICATOR
The number one mistake we should try to avoid is how to use the MACD crossover. The MACD crossover gives a false signal at times especially if the market is in range, but it works effectively if there are strong trending markets. So learn the better way to use the MACD crossover.
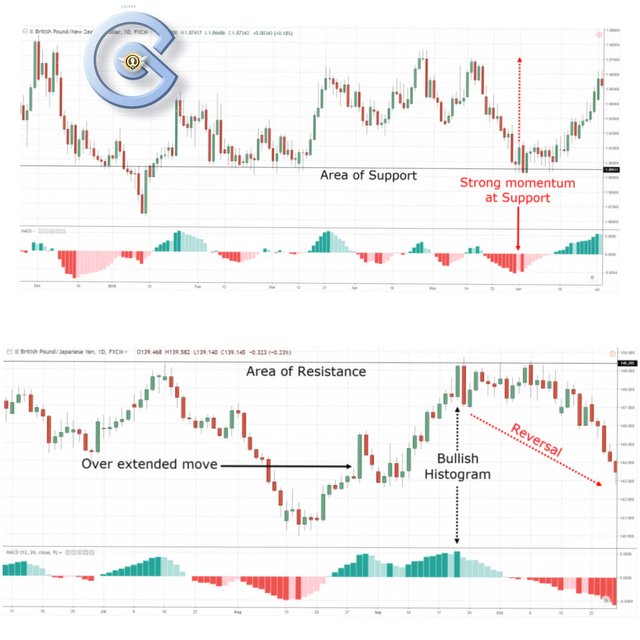
Another mistake we must avoid is misinterpreting of the MACD histogram. If there is strong momentum on the MACD histogram, many see it as the opportunity to buy and accumulate more but believe me, that step is wrong. Once a strong momentum occurs, it is too late to dive in because there might be a reverse in a short time. The best approach to a strong momentum is to go the opposite side, i.e trade the reversal.
How to use the MACD histogram and identify momentum reversal
Trading required a lot of experience or else, you might lose all your capital. I remember when I joined trading around 2017, by then, I only followed the bullish candle. I do wait till a bullish candle breakout before I will start buying. The end point is not funny, I usually lost all my capital at long the line.
It is too late to enter a trade once breakout occured. The best time to buy is when a market is about to reverse in the opposite direction. Knowing when to buy or sell is where the MACD histogram becomes very paramount.
Here is how to use MACD Histogram...
Wait for the market price to produce a trendline
The MACD Histogram will then display the strong momentum
Finally, wait for the price to decline before taking a step to trade in the opposite reversal.
HOW TO INCREASE YOUR WINNING RATE BY USING MACD INDICATOR
There are many concepts to use, but one of the simplest one is using the MACD indicator to determine the higher timeframe trend. After discovering the higher timeframe trend, then we will choose it as our trade direction.
Here is how to define your higher timeframe:
Let's say your entry timeframe is 4-hour, then your higher timeframe is the Daily.
If your entry timeframe is the Daily timeframe, then your higher timeframe is the Weekly.
If your entry timeframe is the weekly, then your higher timeframe will be monthly.
This continues like that...
Let me illustrate how it works …
First step is to define your higher timeframe. After defining it, if the higher timeframe MACD Line crosses above the Signal Line, at your entry point, look for a long setups; but if the higher timeframe MACD Line crosses below Signal Line, at your entry point, take a short setups
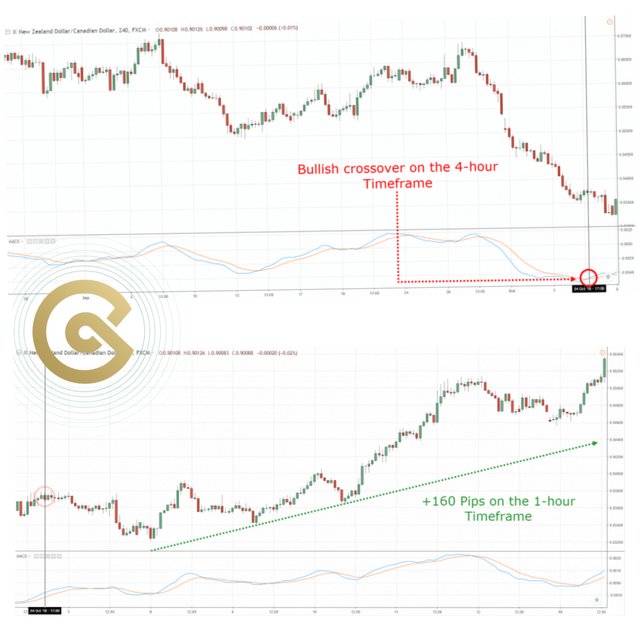
Example of when MACD Line crosses above Signal Line
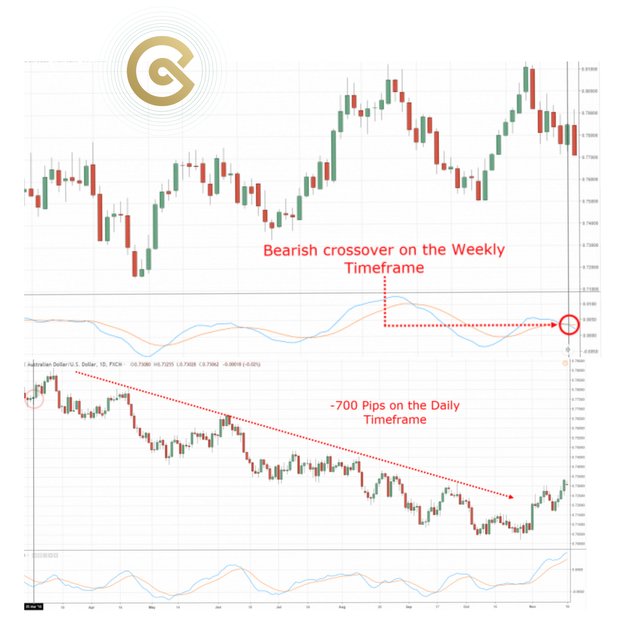
Example of when MACD Line crosses below Signal Line
How to know when a breakout is about to occur
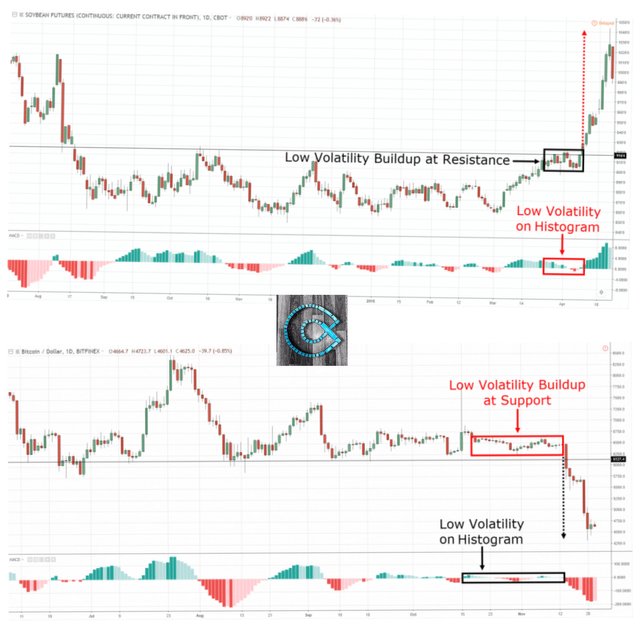
I want you to pay attention to this because it will help you as a trader. Many think that breakout occured once there is enough volatility, but it is not true. At this stage, breakout is closing its trend. The true fact is that breakout occured if there is lower volatility in the market. Note this, breakout is about to occur once you see that the range of the candlestick is getting small and smaller. Though you need to be sensitive in order for you to spot this ideology. It is not easy to spot that kind of candle even if you uses glass lens, but the MACD Histogram can help you to easily spot such a tiny position.
There are periods whereas the price structure or trendline on the MACD Histogram nearly disappeared and everything looks flat. This is exactly the period breakout is about to take place. Wait for the price to break the market structure and enter the trade immediately. This is just a simple logic using MACS histogram to spot when a breakout is about to occur. Furthermore, we should know that the MACD histogram could remain flat for undefined time, there are cases where it can remain flat for like next 4 candles, 5 candles etc, but make sure you wait for the trendline to break the market structure and find your ways in.
Conclusion
With these little pieces of knowledge about how to use MACD, I believe you will do well while trading. Please go over it, read again and practicalize it.
I will recommend you to choose CoinEx
Exchange if you want to trade cryptocurrency. CoinEx
is the best exchange for trading digital assets. They offer the best services and features that will make you enjoy your trading. Choosing an Exchange is not about popularity, but about the quality of services they offered. CoinEx
is very secure, faster and reliable.
Register, trade and start making money