This video was originally published 8/8/2019

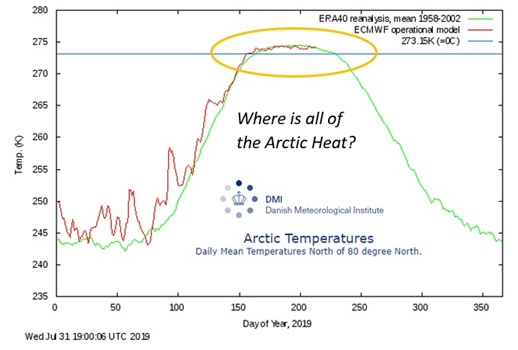
A few days back, I was asking the mainstream media where the Arctic heat is, because the Danish Meteorological Institute (DMI) reported that the mean temperature from 80 to 90 degrees north to the North Pole are low. The story from the corporate media, however, claims that it is an all-time runaway heat, which is not the case as shown in this chart.

And then, a very creative commenter on the global warming side points out the hypocrisy of using data to show that the Arctic is stable yet saying that a very limited data of the Arctic is being used, so, I am not sure. But 80 to 90 degree north latitude is the entire top of the planet, and they keep saying that a runaway heat is there, and ice is melting into infimum. Real data, however, shows that it is not so.

They did not include 78 degrees north latitude or 75 or 76 degrees north latitude, and if this is tolerated, we might as well jump all the way down to Spain and include it in Arctic measurements. A glimpse at 80 to 90 degrees north latitude, the North Pole, shows that it is not heating as the corporate media is reporting. The graph shows that temperature has remained stable and is even below the normal.

Claims that there is more ice melt this year in Greenland are also unsubstantiated, even data from Polar Portal shows otherwise. The red line is 2011–2012, and the blue line is our current melt season, 2018–2019. As can be seen, it is not losing nearly as much ice.
If it was true that gargantuan melt happened, coastal flooding should have already occurred. For instance, if the melt season in 2011–2012 was so much, sea levels should have risen. The 8-year lag time should have filled the oceans, at least in the Atlantic. And now, to make it worse, this corporate narrative echo box is trying to make this year, an even more runaway heat than 2011–2012. Judge for yourself.

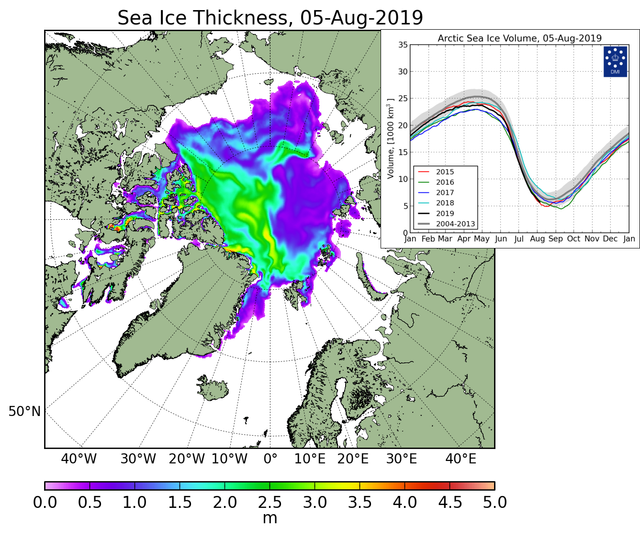
To claim the this is the ‘lowest’ year ever for ice is a bit disingenuous, because we have not even reached a low melt point which will occur in the first weeks of September.

So, for this report on the most ice melt ever, look at DMI once again. The black line is the current year, and as you can see, it ran over other lines during significant melt portions of the melt season during the summer. It is a basic knowledge that snow & ice normally come in winter and melt in summer although in 2019 snow also came in June and July. As you can see, the 2019 black line looks like it is above 2015, and just a sliver below 2016. So, how did this year become the lowest year ever? Can’t we wait and see where it tapers out at the bottom of the melt season in September, and then draw final conclusions if it is the lowest amount of ice ever?

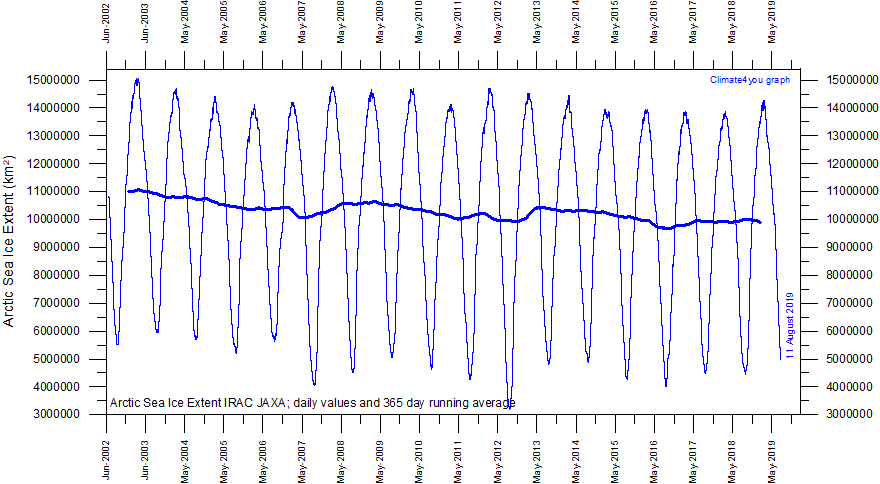
I have also linked Climate4you in this article because this is a great site to get the day’s charts. The chart below, for instance, shows the sea ice extent which seems to level off. Meanwhile, the dark blue line at the center is the average. Does the trend look like runaway melting?

This is also another good resource, the University of Alabama Huntsville (UAH) Global Temperature Updates, Dr. Roy Spencer’s site. This shows monthly temperature reports.

For this particular graph, it shows that the July 2019 temperature is 0.38°C, which was down, from June’s 0.47°C.

This, however, is where we get into splitting hairs because the corporate media does not like to use data set that shows temperatures that are not all-time record hot, like the Climate Reanalyzer. So, Dr. Roy Spencer explains how a substantial departure occurred from the data that Climate Reanalyzer uses. Take note, Climate Reanalyzer always puts out the hottest temperature sets on the web. Anyway, by all accounts, (UAH) put July 2019 the 4th warmest, in the last 41 years, not the hottest.

Mini Ice Age Conversations Podcast
iTunes: https://itunes.apple.com/us/podcast/adapt2030
Soundcloud https://soundcloud.com/adapt-2030
Libsyn http://adapt2030.libsyn.com/
(MIAC #242) Alarm Bells: Forecasting Food Prices Divide & Conquer Right Now

For the bi-weekly Grand Solar Minimum climate update newsletter from myself, David DuByne, (ADAPT 2030) jump over to oilseedcrops.org you can enter your email and sign up. Move your mouse around for about 10 seconds and this box will pop up.
Join ADAPT 2030 NEWSLETTER http://www.oilseedcrops.org

“Help support the adapt 2030 channel on brighteon so we can keep Grand Solar Minimum information free to access.”
https://www.brighteon.com/channel/adapt2030
Support ADAPT 2030 by Visiting Our Sponsors
ADAPT 2030 & My Patriot Supply 2-Week Food Supply with 92 servings
www.preparewithadapt2030.com
True Leaf Market Heirloom Seeds ADAPT 2030 True Leaf Market Link
ADAPT 2030 Amazon Grand Solar Minimum Book Store https://www.amazon.com/shop/adapt2030
Upheaval: Why Catastrophic Earthquakes Will Soon Strike the United States https://amzn.to/2E7KbBt
*** Today’s Story Links ***
July 2019 Was Not the Warmest on Record
http://www.drroyspencer.com/2019/08/july-2019-was-not-the-warmest-on-record/
http://www.drroyspencer.com/
July Global Temperatures


Different global temperature sets

Evidence that ERA5-based Global Temperatures Have Spurious Warming
http://www.drroyspencer.com/2019/08/evidence-that-era5-based-global-temperatures-have-spurious-warming/
Sea Ice Charts DMI August 05, 2019

Total Northern Hemisphere Snow Cover 2019
![]()
Sea Ice Charts
http://climate4you.com/
August 05, 2019 sea ice chart 1979-2019

Greenland cumulative melt vs gain
http://polarportal.dk/en/greenland/surface-conditions/
DMI 80N temperatures in the Arctic
http://ocean.dmi.dk/arctic/meant80n.uk.php
Typhoons Asia Pacific
https://www.cwb.gov.tw/V7e/prevent/typhoon/ty.htm?
*** ADAPT 2030 Social Media Links ***
PATREON https://www.patreon.com/adapt2030
YOUTUBE ADAPT 2030 Mini Ice Age 2015–2035 Series on YouTube
BITCHUTE https://www.bitchute.com/hashtag/adapt2030/
BRIGHTEON https://www.brighteon.com/channel/adapt2030
STEEM https://steemit.com/@adapt2030
MINDS https://minds.com/ADAPT2030
MEDIUM https://medium.com/@globalcooling
FB https://www.facebook.com/Miniiceage
TWITTER https://twitter.com/adapt2030
STEEMIT https://steemit.com/@adapt2030