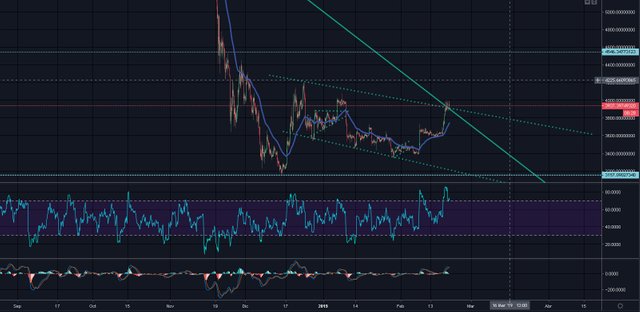
By observing the BTC/USD graph, we can locate a bullish wedge that has formed since early December 2018 this harmonic pattern that has formed is a clear signal to change trend, but may be able to break the bullish wedge?
The volume in the market cap is decaying gradually this paints a price regression to the closest support of 3200 to 3100 usd and a return of the bearish sentiment of the market.

while bitcoin has these small upward and downward movements that are scary meanwhile the Icos move with great volatility, despite that the projects that are actually contributing to the crypto world are advancing and for this month of March there are very good fundamentals for these Icos, I hope Bitcoin does not ruin this "Again".
Authors get paid when people like you upvote their post.
If you enjoyed what you read here, create your account today and start earning FREE STEEM!
If you enjoyed what you read here, create your account today and start earning FREE STEEM!