Özellikle yatırımlarımızı trend başlarında yaklarsak büyük kazançlar elde edebiliriz.Trend çizgileri bize o varlıkta ne kadar süre kalacağımızı sağlar ve nereden o yatırımdan çıkaracağımızı gösterir. Böylece risk almadan ne yaptığımızı bilerek hareket etmiş oluruz.
Örnek olarak iki tane trend göstermiş olacağım bir varlığın nereden düşüş göstereceği ya da bir varlığın nereden yükselişe geçeceğini göstereceğim
Especially if we approach our investments at the beginning of the trend, we can make big gains. Trend lines allow us how long we will stay in that asset and show us where we can get out of that investment. Thus, we act by knowing what we are doing without taking risks.
For example, I will show two trends where an asset will fall or where an asset will go up.
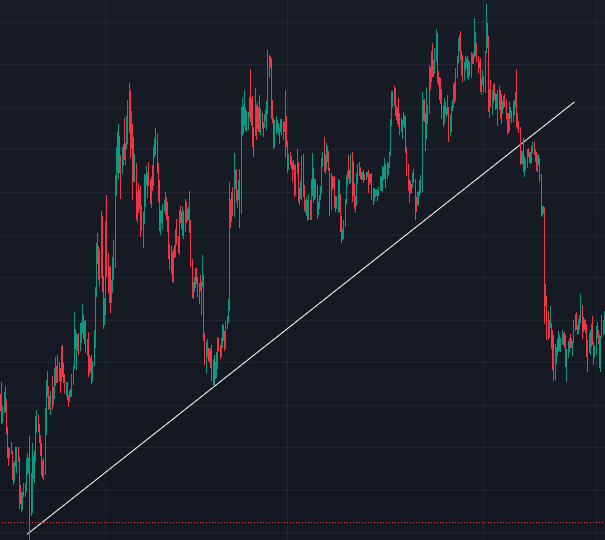
1- Yüseliş trendi / uptrend

Trend çizgimizi aşşağıdan çizdiğimizde, trend çizgisine dört kere temas ettiğini ve en son 4. temasta artık yükselişin bittiğini varlıktan çekileceğimizi belirtir.
When we draw our trend line from below, it indicates that it has touched the trend line four times and that the rise is over at the last 4th contact and we will withdraw from the asset.
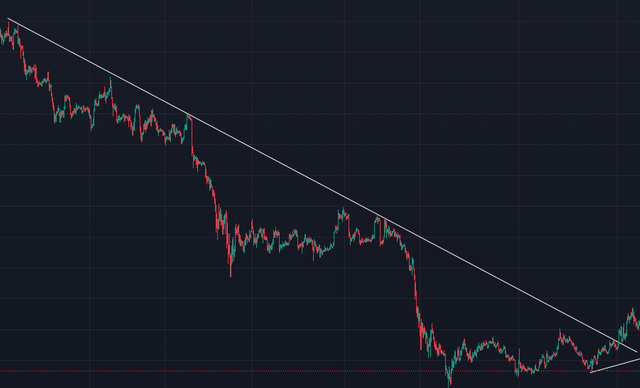
2- Düşen trend / falling trend

Trend çizgimizi en tependen çekerek çektiğimiz çizginin beş temas noktası göstermektedir. Düşüşün istikrarlı bir şekilde devam ettiği ancak 5. noktada artık düşüş trendin bozulup yükselişe geçtiği görülmektedir. Bu şekilde bir trend başlanğıcı yapıp yatırıma geçebiliriz.
Pulling our trend line from the top shows the five contact points of the line we drew. It is seen that the decrease continues steadily, but at the 5th point, the downtrend is broken and started to rise. In this way, we can make a trend starter and start investing.