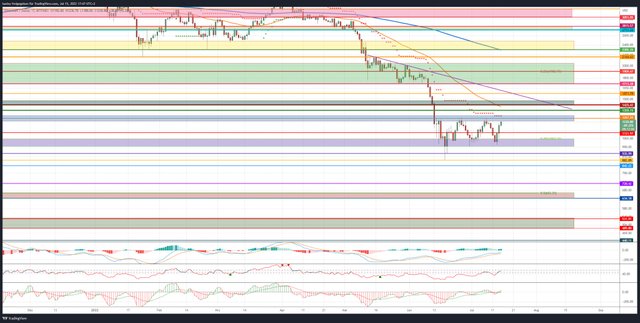
Ethereum (ETH) is again attempting to scale the key resistance at $1,267 after stabilizing above $1,000.

Price analysis based on the value pair ETH/USD on Bitfinex
Ethereum Recap :
- The ether course is currently trying again to start the strong resistance area between USD 1,241 and USD 1,297. Statistics say that the third breakout attempt above a horizontal resistance has an increased probability of successfully retaking the resistance.
- The fact that the ether price was able to form a higher low in the middle of the week despite a price setback is also to be seen as positive.
- Although the launch of Ethereum 2.0, also known as "The Merge", has been postponed again, investors have recently increasingly invested in the second largest cryptocurrency.
- The fact that Ethereum was able to defend the purple support zone again and that the price did not slip back below the psychologically important USD 1,000 mark further increases the chance of a bottoming out.
- It would be desirable for the weekly candle to optimally close above USD 1,297.
However, US consumer spending data released at 2:30 p.m. (CET) came in above analysts' expectations, giving the US Federal Reserve more room for monetary policy measures to curb inflation.
Important course markers for the coming trading days :
- If the buyer side again fails to break out of Ethereum above the blue resistance area, it would be rated bearish in the short term. Ethereum could then fall back towards USD 1,121 before the bulls could start a new breakout attempt.
- On the downside, the Ethereum price remains well supported between $1,063 and $992.
- The RSI and MACD indicators continue to show a mixed picture. While the hourly RSI indicator is already overbought and forming a bearish divergence, the 4-hour chart's RSI continues to show a solid buy-signal. This is supported by active buy signals from the MACD in the 4-hour chart and the daily chart. The RSI is now also back in the neutral zone between 45 and 55 on a daily basis. This means that the danger of a correction is increasingly limited. If the RSI breaks above 55, Ethereum will receive another strong buy signal.
Bullish Scenario (Ethereum) :
- In the last few days, the bulls have shown the will not to let Ethereum break away again.
- Once again the purple support area could be defended.
- The buyer camp must now do everything possible to raise the ether price above the first relevant resist level at USD 1,267 in a timely manner.
- Just above USD 1,297 there is another strong technical chart hurdle with the Supertrend.
- If a sustained breakout above this resistance cluster is successful, a march through to USD 1,359 should be planned. The EMA50 (orange) is currently running between this resist and USD 1,425.
- If this area is also broken through without major pullbacks and the upper edge of the resistance zone at USD 1,480 as well, increased resistance from the bears can be expected at USD 1,571 at the latest. Here is the downtrend line from the high at $2,164.
- If Ethereum does not bounce back in the long term and the crypto market also remains bullish, Ethereum could march through to the demolition edge at USD 1,713 in the coming weeks. Significant profit-taking and renewed sell-off attempts by the bears are to be planned here.
- In the short term, ether price is likely to consolidate to at least $1,571 before a fresh attack on $1,713.
Plan for further price increases :
- The next price target in the form of the 23 Fibonacci retracement at USD 1,909 is only activated when the buyer side can lift the ether price above USD 1,713 at the daily closing price.
- If the crypto market continues to gain momentum, investors will focus on further recovery targets at USD 2,050 and USD 2,164 in the coming months. Further price setbacks are to be planned again at USD 2,164.
- As long as Ethereum sustainably stabilizes above USD 1,713, the bulls will attempt to target the yellow resistance zone between USD 2,305 and USD 2,485. Furthermore, this resistance area acts as a maximum bullish price target for the coming trading months.
- Only when Ethereum recaptures this resistance area sustainably will the next relevant target at USD 2,733 be targeted.
Bearish Scenario (Ethereum) :
- The bears seem increasingly tired. Again failed to sell Ether price back below the purple support area.
- Although the sellers still have the upper hand, a breakout above USD 1,297 would turn the tide in favor of the bulls, at least in the short term.
- The aim of the bears must now be to sell Ethereum back below USD 1,121 in the direction of the weekly lows.
- Only when USD 1,062 is broken through and the weekly low of USD 1,010 can also be dynamically undercut is a fall back to USD 935 conceivable.
New lows for the year are in the focus of investors :
- If Ethereum does not find a foothold here, a retest of the annual low at USD 882 should also be increasingly planned.
- If Ethereum does not stabilize here and subsequently generates a new annual low, the view should be directed towards USD 720.
- If Bitcoin (BTC) also generates a new annual low, Ethereum could then break into the zone between USD 663 and USD 634. In addition to the higher-level 50 Fibonacci retracement, the breakout level from December 2020 also runs here.
The buyer side should try again to move the Ethereum course up again. - If the stabilization attempts fail, a sell-off to the maximum bearish target zone between USD 531 and USD 489 cannot be ruled out in the medium term.
Your post was upvoted and resteemed on @crypto.defrag
Downvoting a post can decrease pending rewards and make it less visible. Common reasons:
Submit