
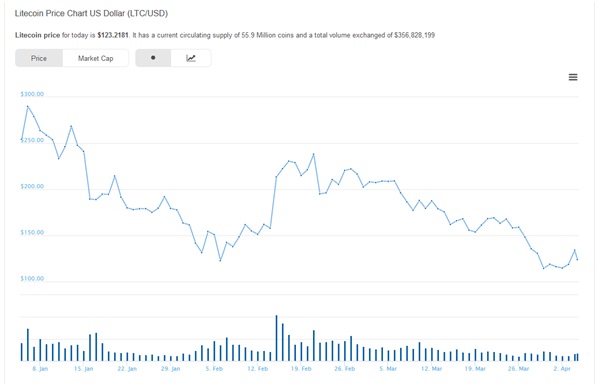
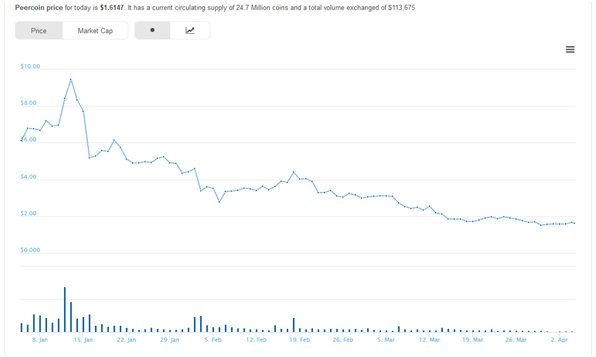
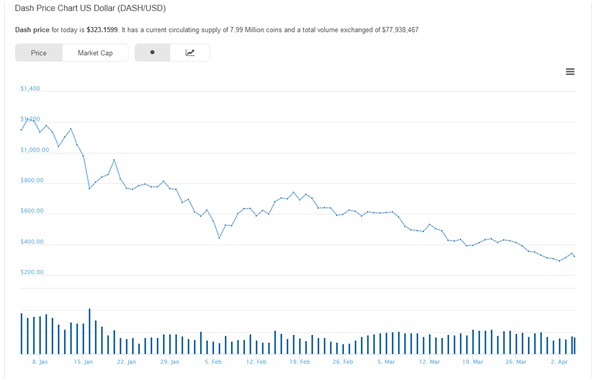
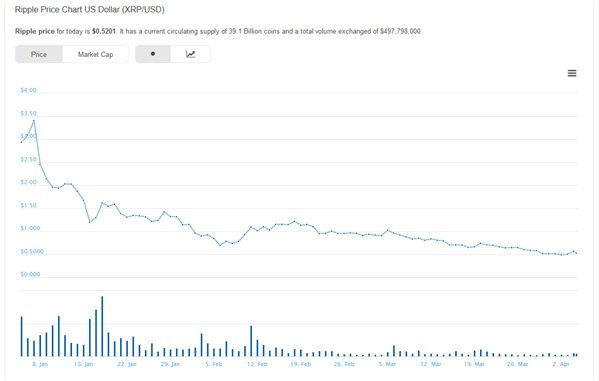
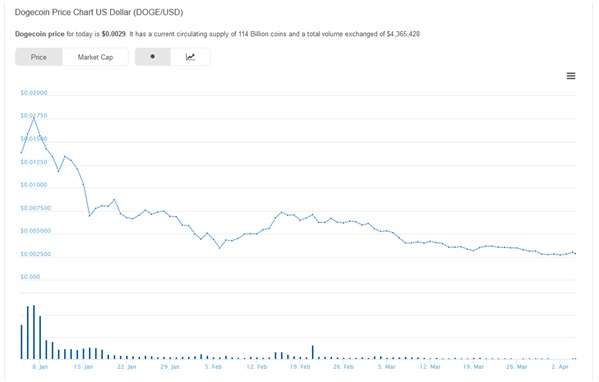
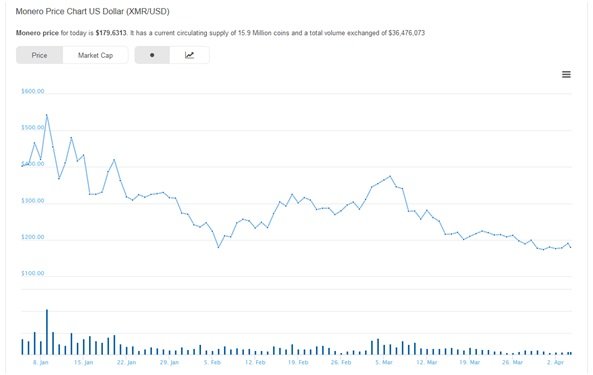
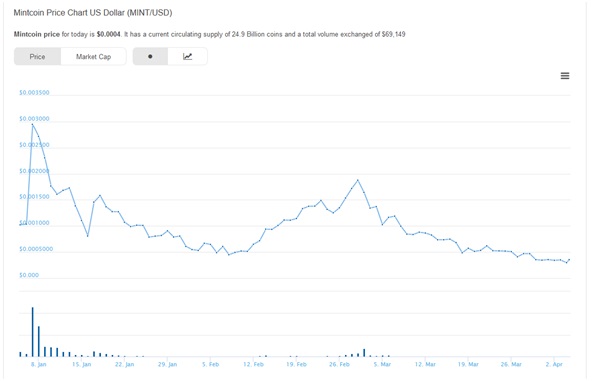
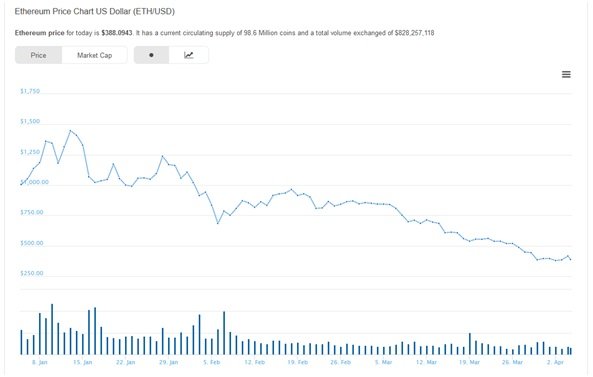
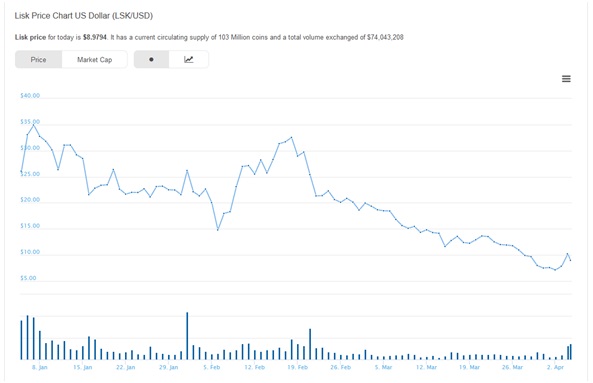
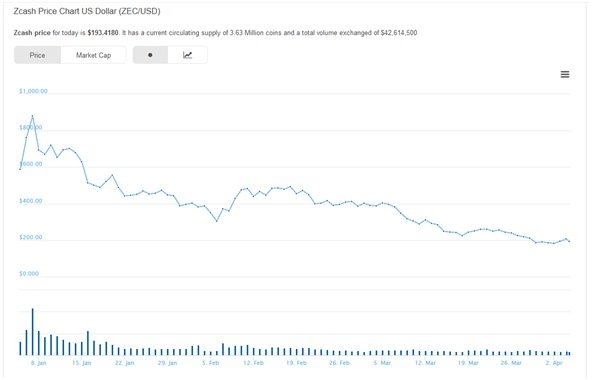
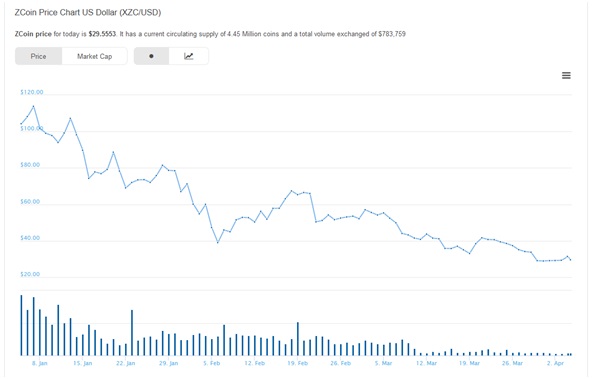
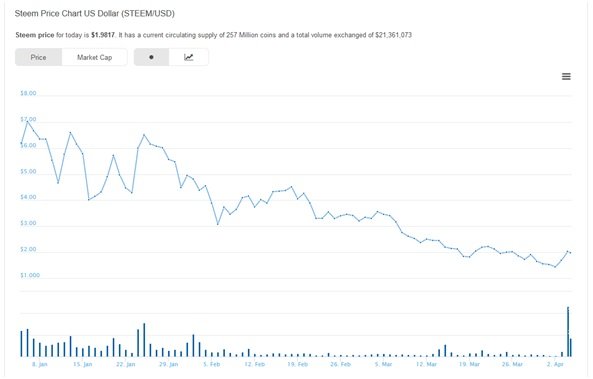
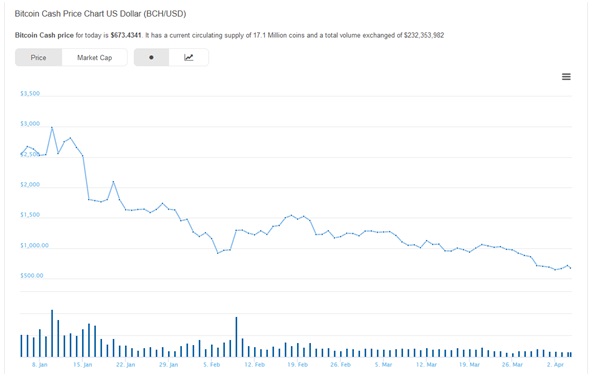
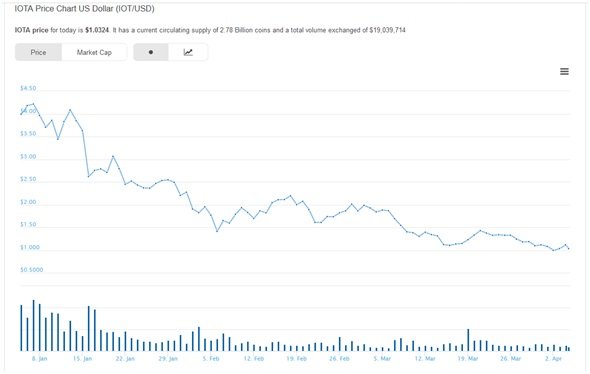
I was wondering what happened to coin prices in 2018, when market is already saturated and kind of stable. To get a point I check the random coins (15 coins that I analyse in my posts) graphs and their price changes.
During this evaluation I have noticed similarities between the coin prices in the graph extremes (points where there is low point of price or peak in the value of price). BTC, LTC, MOnero, ZCoin, SteemCoin got sharper changes on the graph and other coins got smoother changes in the price graphs.
What I might see from those presentations of price graphs is that coins are following similar price shape, or that they are acting as kind of a clones. reason for this by my opinion is that mostly changes in price come from mining and not for investing in the specific coin.
Hey @crypto-direction, the markets are pretty crazy right now. Crypto is back to a weird space but I know long term it's still what we're all hoping it will be! Cheers
Downvoting a post can decrease pending rewards and make it less visible. Common reasons:
Submit
maybe for short buy/sell options, but not really for long time investors. If you sell BTC, and buy let say LTC, they follow same pattern, then why change coins. And changing coins can be really good investment some time, but not in this case presently.
Downvoting a post can decrease pending rewards and make it less visible. Common reasons:
Submit
Coins mentioned in post:
Downvoting a post can decrease pending rewards and make it less visible. Common reasons:
Submit
I have choosed 15 random coins with different prices, age and number of transactions. But all of them follow same patern. Something is unusual. Maybe just for me, but knowing the past of coins, this is weird.
Downvoting a post can decrease pending rewards and make it less visible. Common reasons:
Submit
It has nothing to do with mining. It has to do with demand for crypto. They all follow the total market cap chart. https://coinmarketcap.com/charts/
Downvoting a post can decrease pending rewards and make it less visible. Common reasons:
Submit