.png)
Go to link to view interactive chart;
https://www.tradingview.com/chart/XRPEUR/8zlVOoAW-XRP-EOY-Price-589-More-Like-0-17-XRP-Down-Cycle/
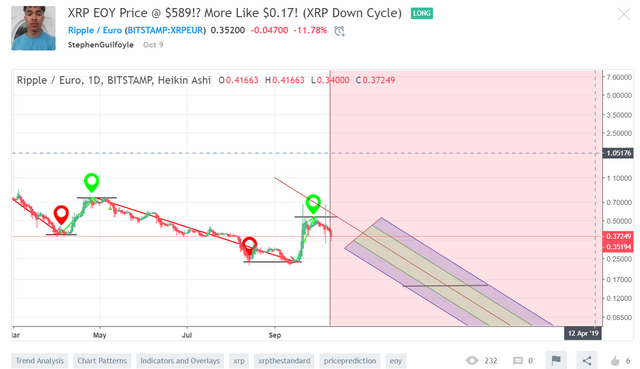
Since xrp's all time high, the price has been retracing ever since.
The percentage drop and the timeframe it took to drop is labelled on the chart.
The question is are we still in a bear market or have we reached the bottom?... hmmm
If we ARE still bearish then the previous patterns of the plumit of price in the past should be a good indication of where the price is proceeding to in the future.
Since all time high, xrp price dropped;
-76% over 33 days.
corrects then drops;
-60% over 48 days
corrects then drops;
-78% over 108-140 days - (This time frame is the outlyer)
Mean = -71.3% drop
Standard Deviation = +/- 9.8%
Upper Limit = -61.5%
Lower Limit = -81.1%
Therefore i believe that the price will drop another approx 71.3% (+/-) 9.8% before we see another bullish market turn around...
with all that being said,
i dont really know,
its a strange world,
the world of crypto,
i could be wrong,
and i have before,
but i hope for low prices,
so i can buy more.
Happy Hodling! :)
Congratulations @stevenit! You received a personal award!
Click here to view your Board
Downvoting a post can decrease pending rewards and make it less visible. Common reasons:
Submit