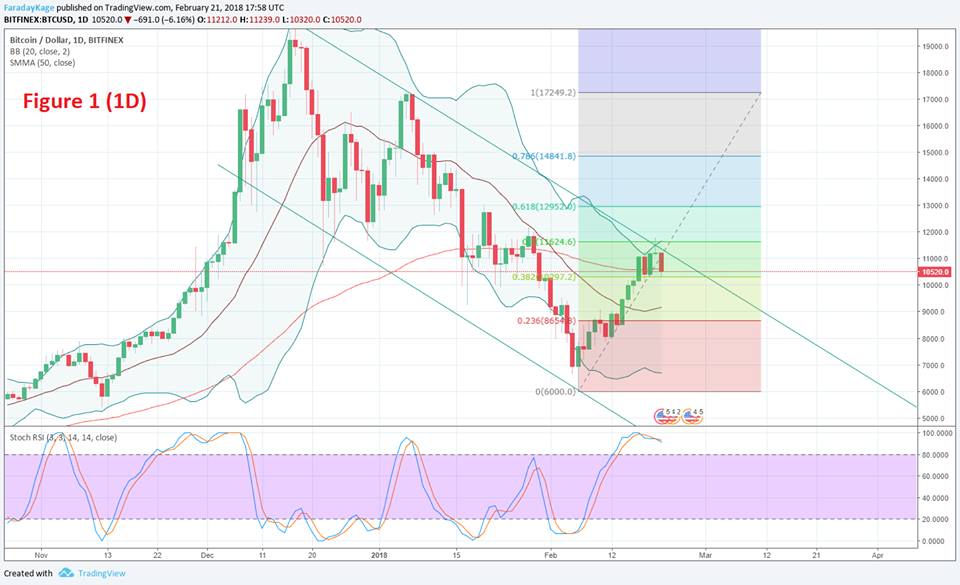
Take a look at the chart, and we start to notice a couple of key things. As a rule, you want to be charting Bitfinex, as it is the biggest market maker.
Refer to figure 1 (daily chart).
We are using a few tools here. The primary ones I want to draw your attention to are our Fibbonaci retracement and our downtrend lines.
The fib retracement has been drawn from the 17.2k peak down to our low of 6k. This is the most recent large price movement- you generally want to select long term highs and lows with a fib retracement, it is not a short term tool.
Fibonacci levels form areas of resistance of support, and the longer term the retracement, the stronger that one can expect the zone to be.
To form a downtrend, you will want to have your trend line run across the tops of the peaks in question, including wicks. As you can see, the current downtrend line has held since BTC's all time high.
Now, in the past couple of days we have had some interesting price action. At 11.6k-11.7k, BTC entered a zone where the downtrend line, Fibonacci level, AND daily bollinger band were all intersecting. What this means is that this is a very strong resistance zone, and it was expected that it might cause a bounce downward, which is exactly what happened. BTC has remained below the downtrend line, despite this brief test above.
However, Fib levels can also serve as support. After the bounce downward, BTC appears to have slowed at around 10.3k.
This puts us into a descending triangle pattern, where we are wedging between a downtrend line and a support level.
You will notice that the Stochastic RSI is quite high. More on Stoch RSI later, but for now, all you need to know is that the asset may be overbought.
Refer to figure 2 (4H chart).
This means that the region at which sellers are trying to sell is LOWERING, and the area at which buyers are willing to buy is UNCHANGING.
What does that mean?
Something's gotta give, but currently bearish momentum is building.
Naturally, we should look to more indicators for more information. We find that the Stoch RSI is oversold on the 4 hour chart, in addition to seeing a small bounce up from the fib line.
Please refer to figure 3.
Let's put the pieces together.
- BTC is overbought on longer time frames.
- BTC is at the bottom of a fib channel.
- BTC is in a descending triangle.
- BTC is oversold on short time frames.
- The downtrend line has held since BTC's ATH.
Together, this means that the likely price action is that BTC will bounce upward, touch the top of the downtrend again (10.9k - 11.1k) and refuel for a larger plunge. If BTC can cut below 10.3k, I would say that we are looking very bearish.
At the latest, I would expect a breakdown by approximately March 1st, as that is where the descending triangle closes.
Thanks everyone, and please post any questions in the comments!