EMA Strategy for long and short term movements
EMA or Exponential moving average is a Indicator similar to SMA or simple moving average but is calculated differently in a way that gives it more weight to price moves, usually it’s used in conjunction with other EMAs to identify upwards/downward momentum and trend reversals
Some of the most commonly used EMA periods are 9,20,50,100, & 200 ema, personally I use them all as that’s what has worked for me in stocks and applies well in the crypto space, understandably that could be crowded for some, EMAs also can act as support and resistance levels during uptrends or downtrend
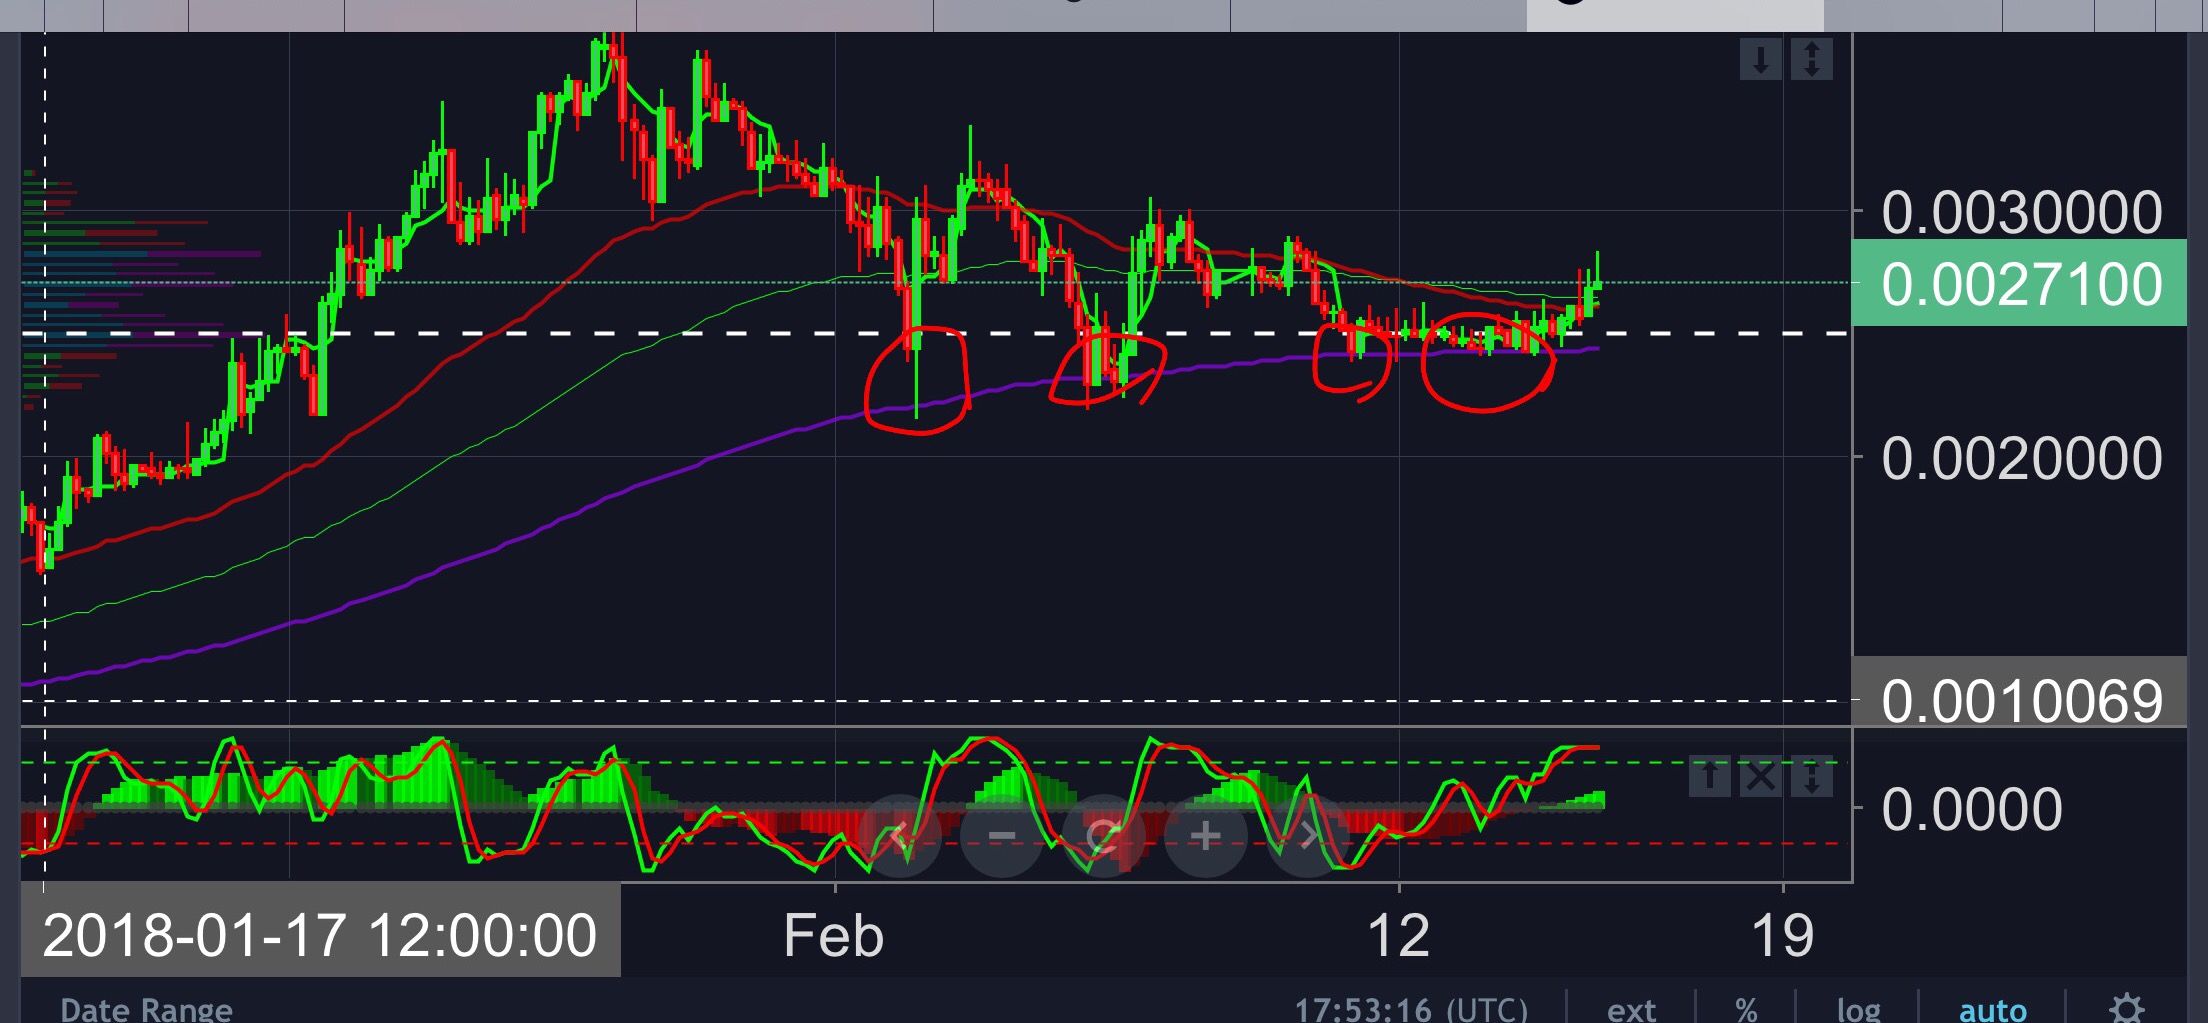
In the example below I show Waltonchain 4hr chart which clearly we can see the 200ema(purple line) acting as a strong support bouncing multiple times, I circled those areas in red

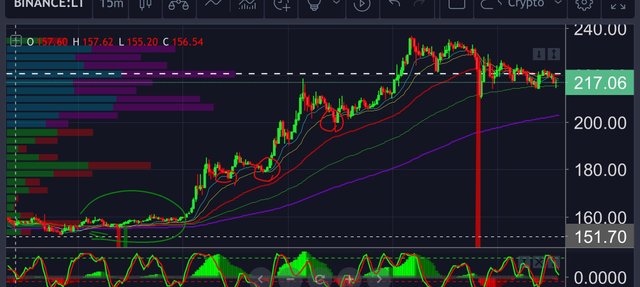
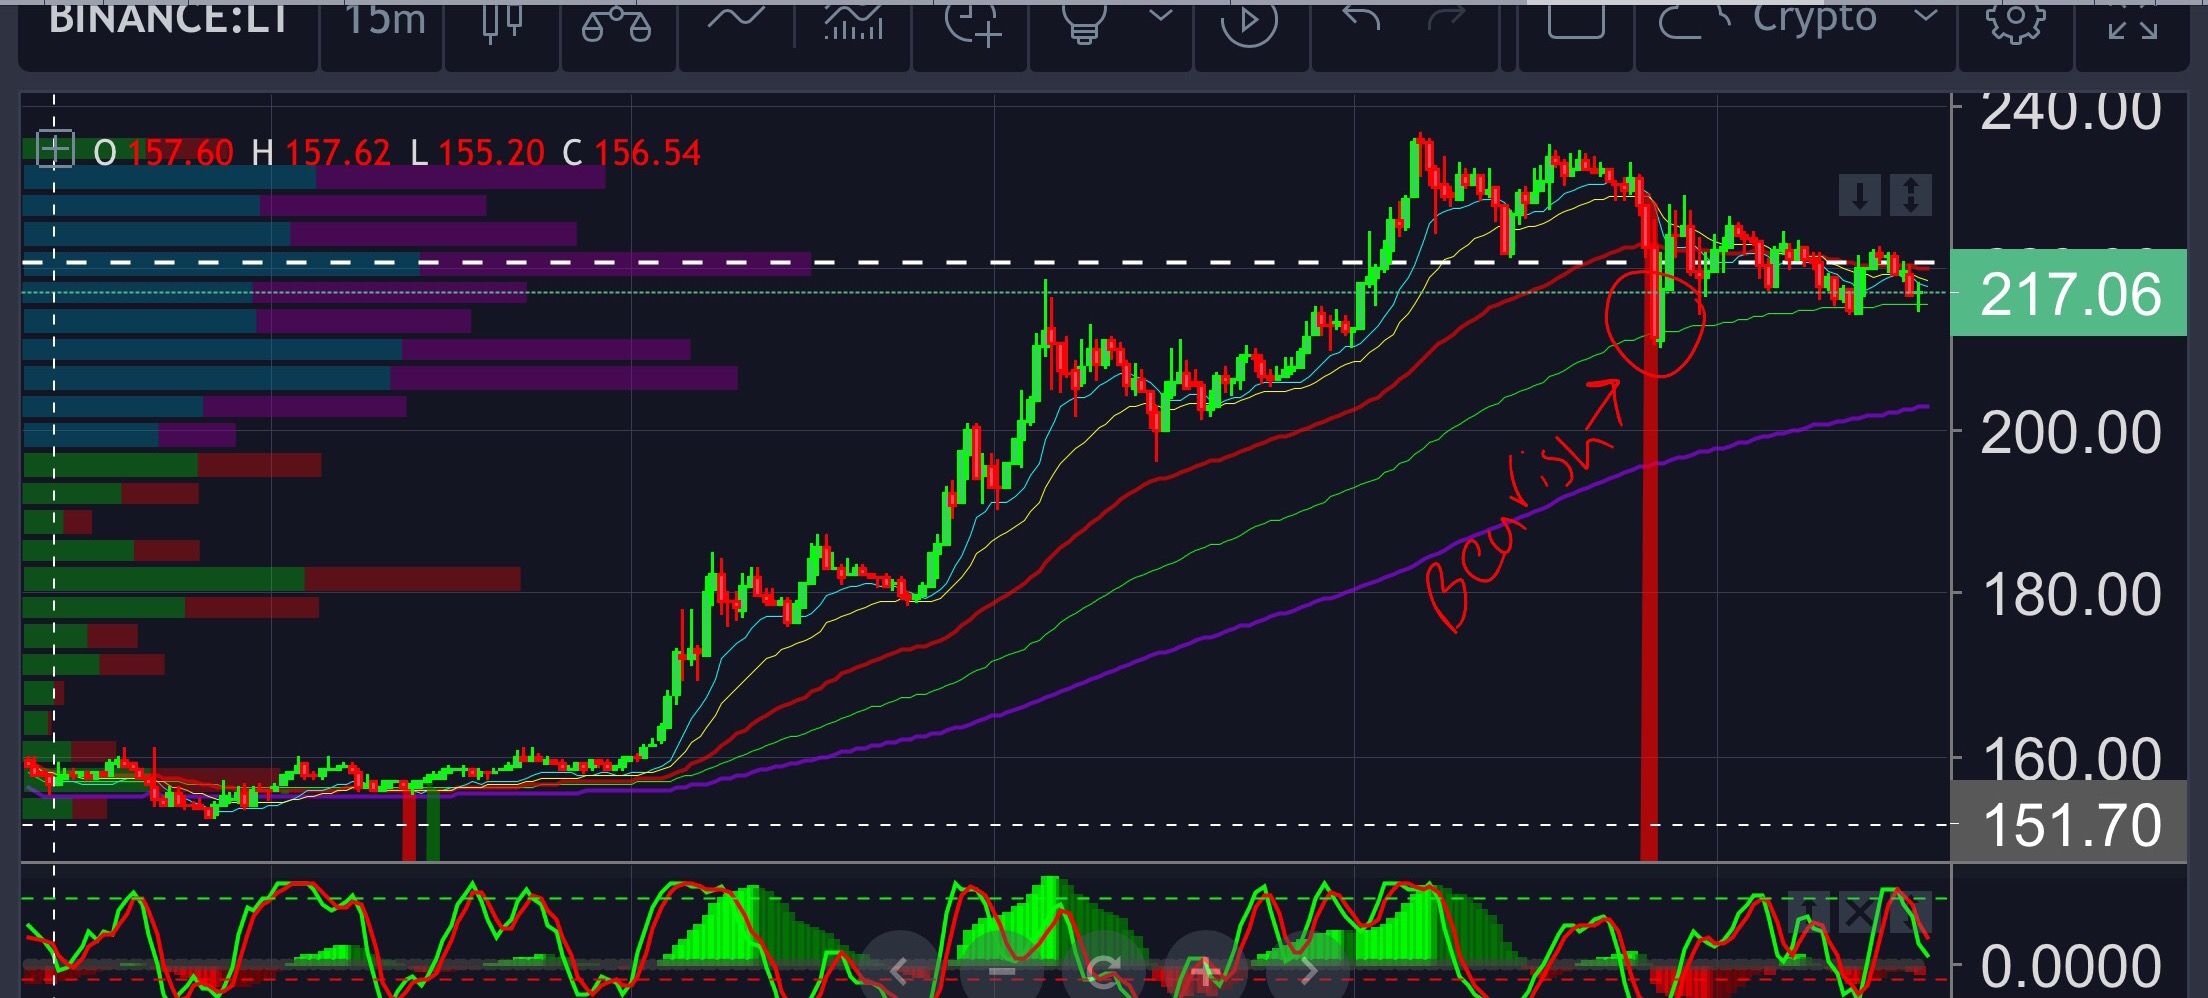
In the next example using Litecoins recent run on a 15min chart, we clearly see the 9 & 20 ema’s as support levels during the uptrend, on my chart I use an indicator that flashed red or green when the 9 and 20 bullish or bearish cross, you can see before the uptrend I got the bullish signal and a sell signal would be the red flash just after the peak of the uptrend.

The green area is an area of consolidation and accumulation to confirm this check to see if volume is decreasing as price action gets tighter and tighter, when the EMAs are tight together it’s indicative of a squeeze and a breakout or breakdown may occur, when the uptrend begins you’ll notice on the chart above that the EMAs expand wide, with the shortest terms breaking above the longer terms
Here’s a picture of the indicator flashing a bearish cross sell signal on Litecoins recent run

When a short term average crosses a longer term average it is considered bullish, a short term average crossing below a longer term average is bearish and indicative of a downtrend, use other momentum indicators to help gauge the strength of the trend/momentum.
I hope this brief explanation of using EMAs as an indicator was helpful to you and made it easier to understand, it is one of the most widely used strategies across multiple markets, if you have any questions please contact me here or on our discord channel, the link is posted in my About me. Thanks for reading and stay green 🤑🤑🤑📈
Congratulations @theroguekage! You received a personal award!
Click here to view your Board
Downvoting a post can decrease pending rewards and make it less visible. Common reasons:
Submit
Congratulations @theroguekage! You received a personal award!
You can view your badges on your Steem Board and compare to others on the Steem Ranking
Vote for @Steemitboard as a witness to get one more award and increased upvotes!
Downvoting a post can decrease pending rewards and make it less visible. Common reasons:
Submit