My Patreon and Telegram: http://bit.ly/trevon_patreon
My Dapp Channel: https://www.youtube.com/channel/UCupNLj0a-zWotI8dXXPNOBQ
Crypto Weather Merch: http://bit.ly/trestore
Steem: https://busy.org/@trevonjb
Twitter: https://twitter.com/bitcointre
Instagram: http://instagram.com/cryptotrevon
Coinigy Trading: http://bit.ly/coinigi
I posted this to the Steem blockchain using #share2steem

Set your account to auto upvote me at 100% and I'll set mine to auto-upvote you at 1% (I have 80k+ SteemPower): http://bit.ly/autovotes
Hello James, Appologise if not to many of your followers understand the below technicals.
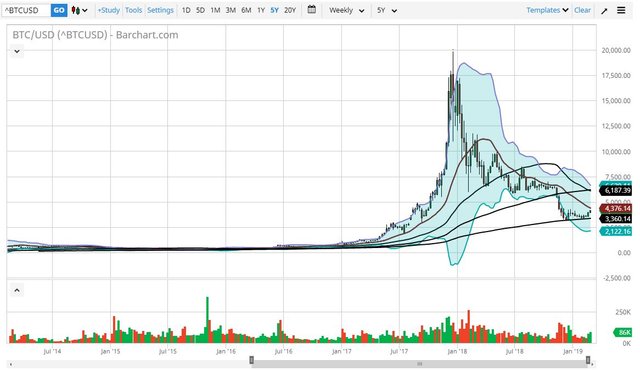
Looking at the 5 year chart it would appear that we may have found a bottom with, price finding support on the 200 MA. The screenshot below shows it bouncing twice.

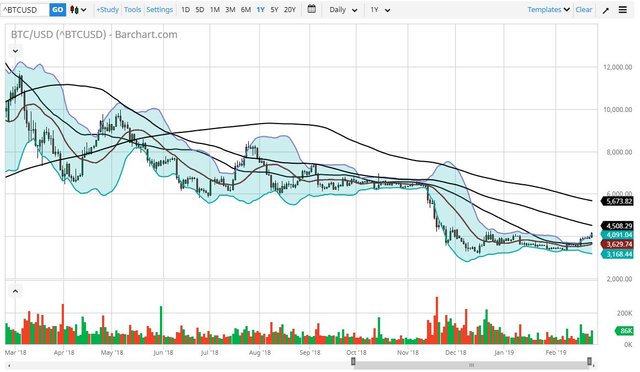
The 6 month chart below shows the bollinger bands tightening with price breaking through the 20 & 50 MA. The price looks to be rallying quite strongly on the short term towards the 100 MA with the 20 & 50 MA looking for a potential crossover soon. Depending on sentiment of BTC, the price will either find resistance around the $4,500 mark or breakthrough to peak around $5,600 before we get more resistance and a short to medium term sell off. I personally think the price will consolidate some more after that sell off, as the 5 year chart shows that the 50 MA has now crossed back underneath the 100 MA & the Bollinger bands are still quite separated.

PS: I know that you will make more sense of the above technical's than most, so sorry if no one else gets it. Technical analysis of charts takes a lot of study, but at the same time is a lot of fun predicting what may or may not happen. James the above charts are based on the 20, 50, 100 & 200 Simple moving averages with a standard 20 MA Bollinger band.
I personally believe that we have bottomed out on BTC, but still have quite some time before enough positive sentiment returns for the smaller moving averages & price to break back through the 100 MA on the 5 year chart. Afterwhich things will look far more bullish & we should then go on to challenge are previous $20K high.
Quick Disclaimer ;-) : These are only my personal opinions based on the technical analysis as i see it. They are not a recommendation to buy or sell BTC. Any trade you make is at your own risk. DYOR! :-)
Downvoting a post can decrease pending rewards and make it less visible. Common reasons:
Submit
Incredible move ... Steem is next
Posted using Partiko iOS
Downvoting a post can decrease pending rewards and make it less visible. Common reasons:
Submit
Thank you so much for participating in the Partiko Delegation Plan Round 1! We really appreciate your support! As part of the delegation benefits, we just gave you a 3.00% upvote! Together, let’s change the world!
Downvoting a post can decrease pending rewards and make it less visible. Common reasons:
Submit
like it how you give your opinions on different timeframe on the chart. btw the 'ads' in between is creative ! =)
————
🚀 🌕
Moon your steem everyday ! Instant Dividend payout after every game - FREE 1000 steemie first 50 players moonSTEEM.com
Downvoting a post can decrease pending rewards and make it less visible. Common reasons:
Submit
Is this a gambling game?
Posted using Partiko iOS
Downvoting a post can decrease pending rewards and make it less visible. Common reasons:
Submit
a new crash game on steem chain, giv it a try
Downvoting a post can decrease pending rewards and make it less visible. Common reasons:
Submit