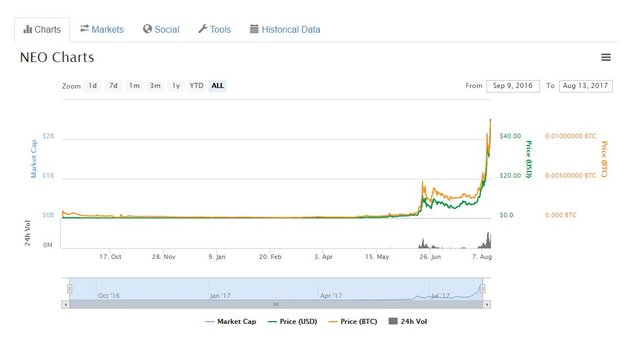
Let's analyze the Chart of NEO, on 26th June the first boom of NEO price from $ 1.91 to $ 8.06 its almost $ 6.5 Dollar then fall and stable at $8 to $10 for 38 days. On August 7th price hit $34 dollar. We basically went up 160% essentially in a week it’s a massive run .
from $ 8 neo hit $ 47 it was more than 400% price increase after the market crash prices went down $13
it was mainly due to china ico ban and Exchange ban but slowly its grow from $13 to $27 dollar and its
expected to hit $100 soon.
Good job
Downvoting a post can decrease pending rewards and make it less visible. Common reasons:
Submit
Congratulations @ishaqueniz1! You have completed some achievement on Steemit and have been rewarded with new badge(s) :
Click on any badge to view your own Board of Honor on SteemitBoard.
For more information about SteemitBoard, click here
If you no longer want to receive notifications, reply to this comment with the word
STOPDownvoting a post can decrease pending rewards and make it less visible. Common reasons:
Submit