Hello everyone, and welcome back. Today we are going to talk about Basic of RSI.
If the Line goes below 30 that simply means it is oversold and if the line goes above 70 which means its overbought. Alot of traders use this concept that can lead to good profit. Buying when it oversold and sell when it is overbought they sell. Using this basic concept can lead to profit as well but REMEMBER INDICATORS ARE ONLY TOOLS TO BUILD MACHINE TO MAKE MONEY, IT IS ITSELF NOT A MACHINE so make sure you use other indicators and strategies before investing.
Watch this video to better understand this concept:
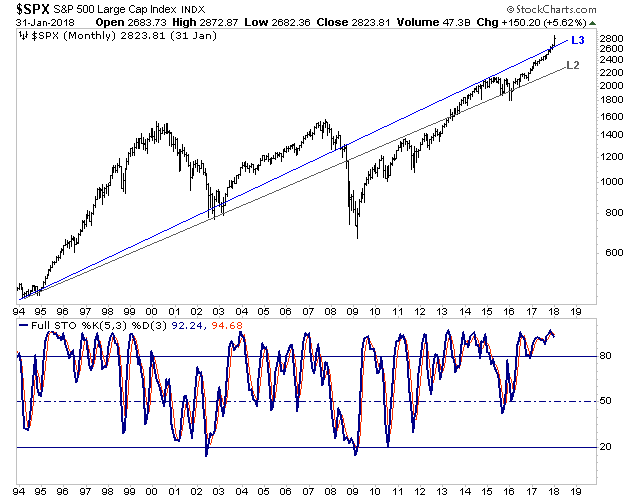
As you can see in this picture how when the RSI is low the price is low as well, but as RSI goes up, the price follows. Also, take this into consideration that JUST BECAUSE RSI AND THE PRICE IS LOW, DOESN'T MEAN THE PRICE CANNOT GO ANY LOWER, AND PRICE DOESN'T ALWAYS SKYROCKET UP AND IT MAY KEEP GOING DOWN as I will explain this more in details in my next video.

I hope you learned something new in this. Make sure you upvote this post and subscribe to my channel on YouTube.