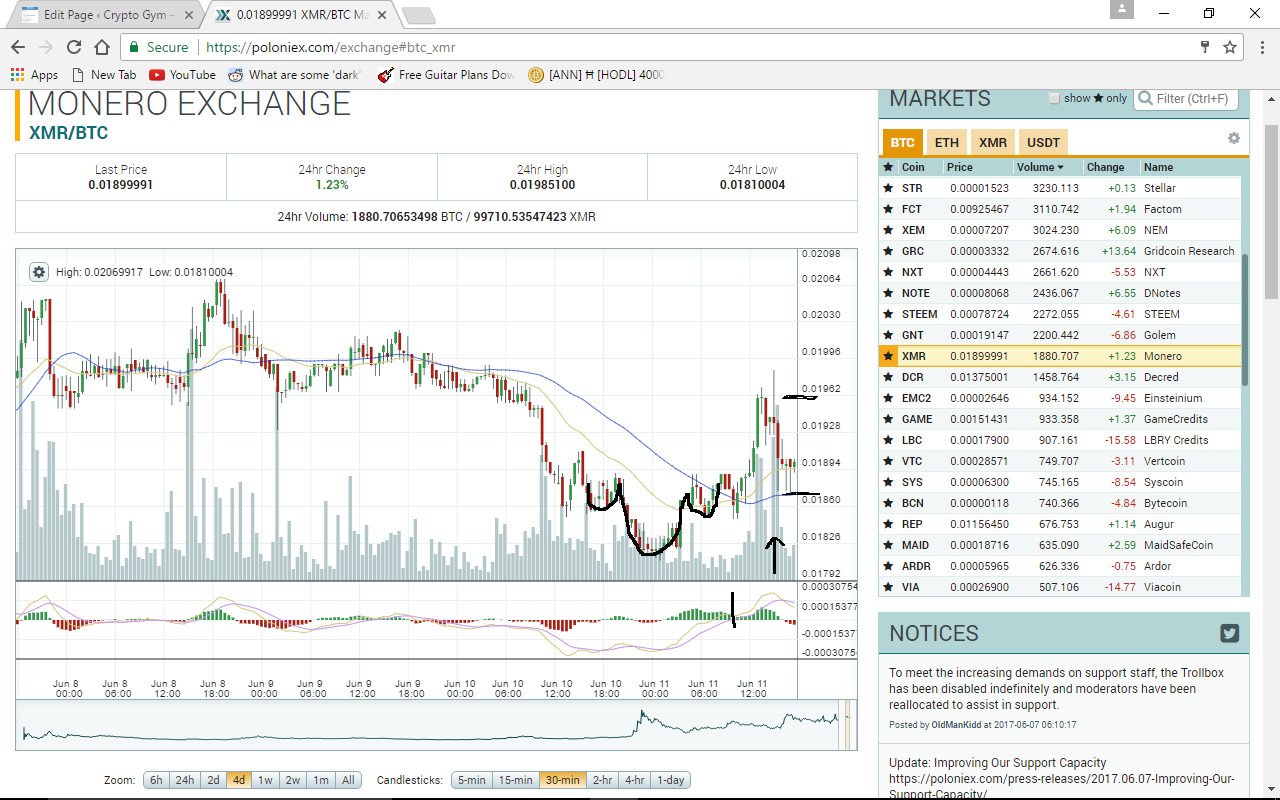
Ok so here is an example of when to trade. This is an inverted head and shoulders pattern and a great sign to buy. If you see a normal head and shoulders pattern expect a price falloff.
As you can see in the screenshot at the end of the head and shoulders is the time to buy marked where you see the 2 SMA lines cross. Another buy signal is indicated by the up arrow showing a large volume going into the currency. You can sell whenever you wish but in this example a 5% gain, minus dealing charges has been achieved in one day. Better than you will get at any bank in 12 months.
