Welcome to what will be a monthly review of the cryptocurrency markets and the important statistics behind them. This month we are looking at data from the exchange Binance, with every BTC cross pair. We will look to add more data from other exchanges and other pairs in the future.
It's been a bit of a mixed bag in April for the cryptocurrency markets. Bitcoin on the one hand is finally trading back above the $5,000 mark and looking stronger and stronger across longer term technicals, however this has led to a fair amount of pain for most Altcoins, as Bitcoin's dominance has grown, many Altcoins are off significantly in BTC terms.
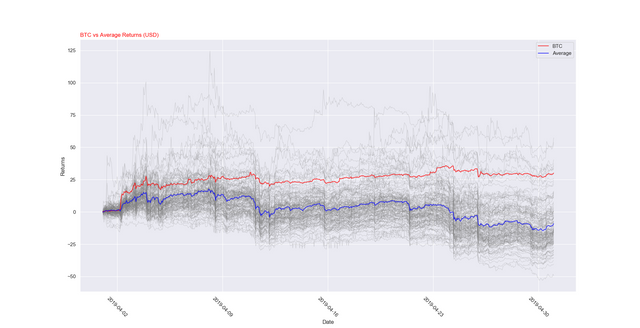
This chart is a perfect representation of what has been going on this month. Here you see the cumulative returns (%) of every coin's USD price on Binance. What we have then done is to highlight Bitcoin (Red line) and the average return of every Altcoin (Blue line) and the results are quite telling. As you can see when Bitcoin initially burst higher, the average Altcoin went with it, but since the first week of April that gap has got wider and wider which has been reflected in the tumbling of Altcoin prices in BTC terms, so much so that Bitcoin has finished the month up over 25% while the average Altcoins returns are sub zero.
So who are this months winners and losers? We have compiled a comprehensive run through of all the important facts and figures for every coin listed on Binance, we are working on adding more exchanges to our scope, but for now let's take a look.
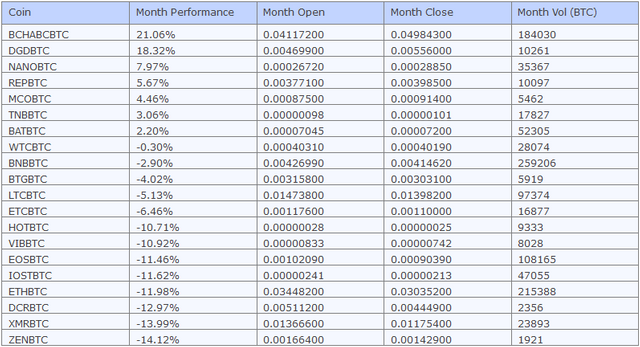
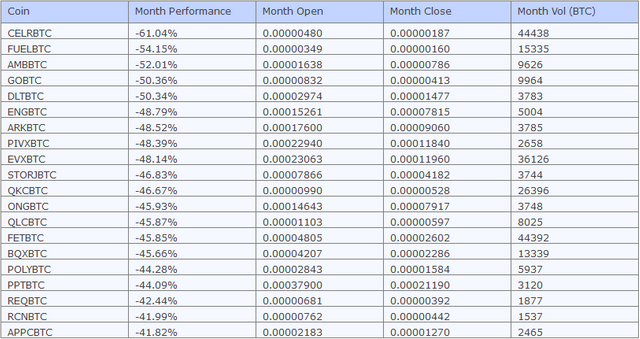
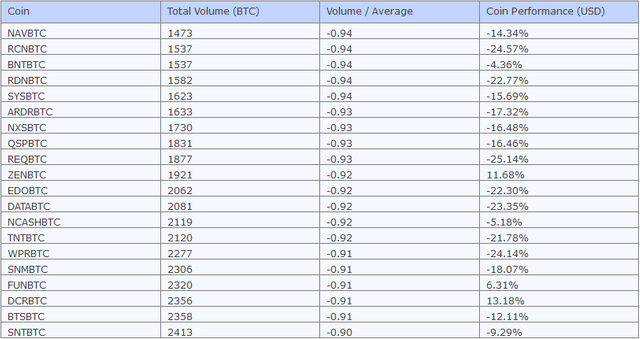
With only 7 coins ending the month in positive territory versus Bitcoin one can quickly see how tough April has been for Alts. Another thing worth noting is the contrasting volumes between this month's winners and losers which we go in to below. Here we have two tables displaying the top and bottom 20 coins based on volume, how that volume compares to the average volume, and its performance this month. It's interesting to note that the top 20 coins by volume had an average performance of 6.57% this month, while the bottom 20 coins suffered a -13.1% loss, suggesting it's always worth trading or holding coins that have at least a reasonable volume to them.

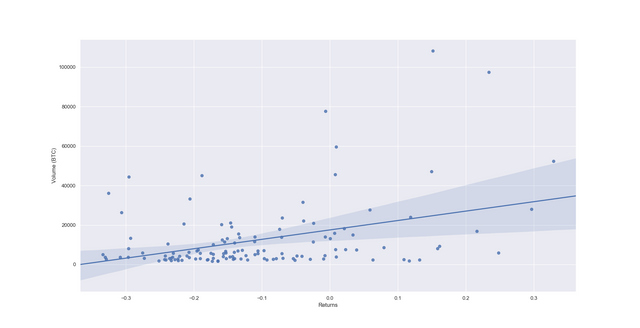
We decided to look a bit further in to the relationship between volume and returns and below we have an interesting plot showing exactly this. We dropped the top and bottom 5 coins when sorted by both volume and the percentage returns for April, and plotted what was left and the results seem to back up what we are seeing in the volume tables above. It's not a particularly strong relationship but does suggest that higher volume coins, if nothing else, are less liable to fall off a cliff.
In this next section we will try and make some comparisons between coins, and draw some conclusions based on this months data. As a means of comparison we will look first at a table of the highest and lowest Z-Scores. A Z-Score for those that don't know is simply the coin's current price, minus the moving average, divided by the standard deviation and is basically a quick and easy way of comparing like-for-like. A negative Z-Score suggests something is 'cheap', while a positive Z-Score suggests something is 'expensive' and by comparing one score to another one can determine what is cheap or expensive in relative terms as well.
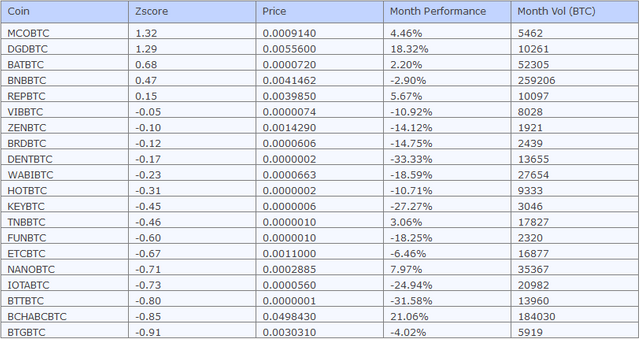
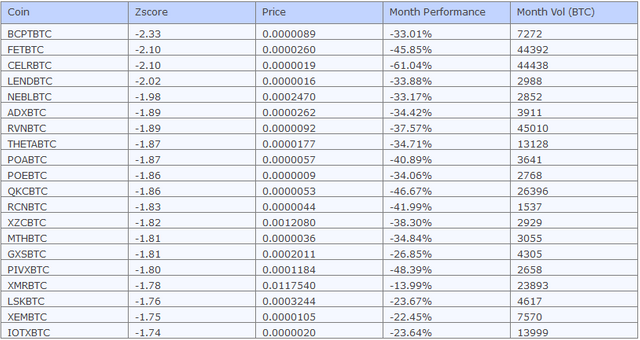
In much the same way that we saw with the performance tables, only a handful of Z-Scores are positive and with an average Z-Score of -1.25 this data once again demonstrates how difficult April has been for Altcoins.
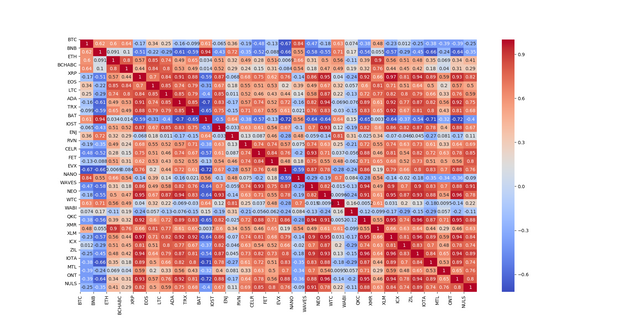
As another way of comparing coins, in an effort to identify what is cheap and expensive, we have also been looking at correlations and regression. As a matter of interest, we see below a correlation matrix of the top 30 coins based on volume on Binance, using their USD price.
We have also taken correlation data for every coin on Binance, and taking the highest correlated pairs, have run regression analysis on each one, to determine which coins are most over or under valued. The table below shows the 5 most expensive and 5 cheapest coins based on this regression analysis.

So as something of a conclusion to all this, given that QKC looks both cheap from a Z-Score point of view and from a regression point of view, and its volumes haven't been too low, perhaps QKC offers some value in being long.
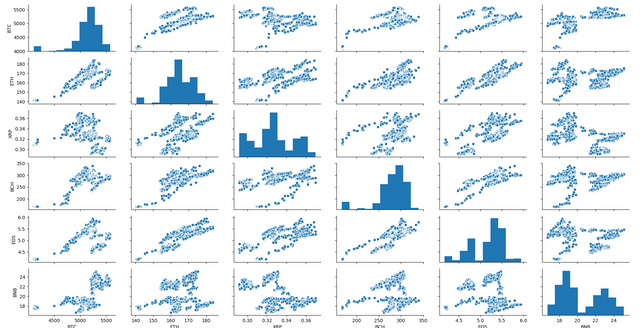
Finally, to wrap things up we thought it would be interesting to see how the top 6 coins by market capitalisation have moved against each other. Here we can see each coin's USD price versus every other coin.
We hope you have enjoyed reading, please check back with us in June for May's round up and visit us at bigcoindata.io for more regular updates. If you have found anything here useful or interesting please feel free to donate a little BTC to 32nSGT61CsGGFc9i5oQZPuqbmtxySycn9Z. GL.