Bitcoin rose for a seventh consecutive session on Tuesday, as the token moved to a three-week high. The price surge came ahead of this afternoon’s U.S. inflation report, which is expected to come in at 8.1% for August. Ethereum continued to trade lower in today’s session, as volatility remained high ahead of The Merge.
Bitcoin
Bitcoin (BTC) rose for a seventh consecutive session on Tuesday, as markets anticipated the release of the U.S. consumer price index.
Inflation in the United States is expected to fall to 8.1% in August, following a decline to 8.5% the month prior.
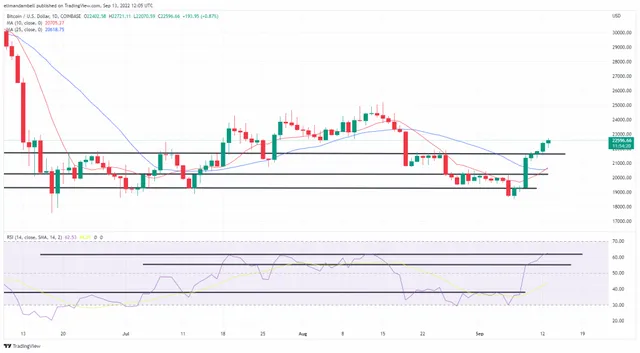
Ahead of the report, BTC/USD surged to an intraday peak of $22,650.73, which is its highest point since August 19.
BTC/USD – Daily Chart
Looking at the chart, this recent spell of upwards momentum has led to a cross between the 10-day (red) moving average and its 25-day (blue) counterpart.
Despite this, an area of concern for bulls will be the fact that the 14-day relative strength index (RSI) seems to have collided with a resistance point at 61.80.
Although the index has marginally moved past this point, and is tracking at 62.57, price uncertainty at this level could see bears reenter the market, sending bitcoin lower in the process.
Ethereum
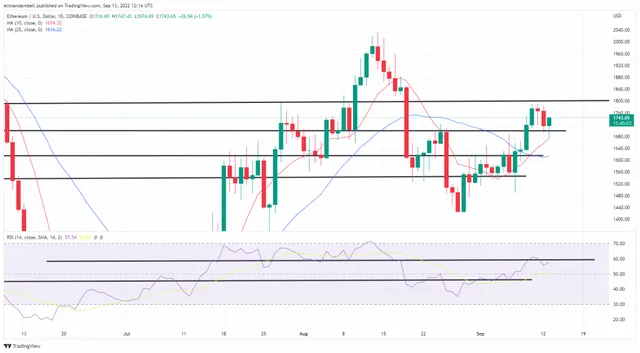
Volatility in ethereum (ETH) continued to be high on Tuesday, as the token fell below its floor at the $1,700 level.
As a result of this earlier breakout, ETH/USD fell to a low of $1,682.43 in today’s session, which was short lived, as bulls swiftly reentered, sending prices higher.
This resulted in a peak of $1,752.76, and as of writing, the world’s second largest cryptocurrency is trading at $1,740.88.
ETH/USD – Daily Chart
Following a move beyond a ceiling of 59.55 to start the week, the RSI is now tracking below this level, with bearish sentiment still present.
Despite this, many still expect the token to climb above $1,800 this week, largely due to The Merge, but also the crossover between the 10-day and 25-day moving averages.
Should these trend lines continue on their current paths, we will likely see further surges in price in the coming weeks.


