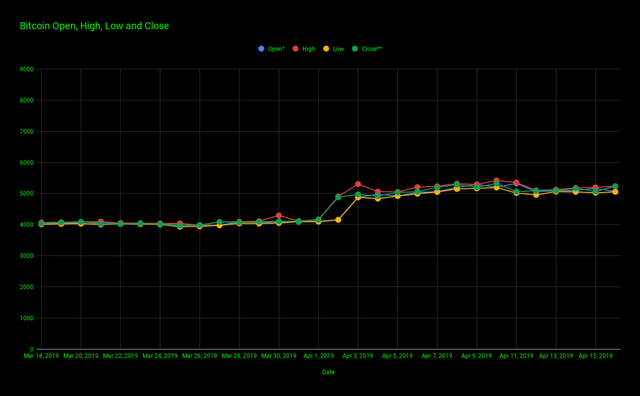
The chart below gives us a look at Bitcoin's open (blue line), high (red line), low (yellow line), and close (green line) for the past 30 days.

The chart below gives us a look at Bitcoin's % volume of market cap (blue line) and Bitcoin's % increase/decrease close to close (red line) for the past 30 days.

The chart below gives us a look at Bitcoin's marketcap (blue line) and Bitcoin's closing price (red line) for the past 30 days.

The chart below gives us a look at Bitcoin's closing price (blue line) and Bitcoin's volume (red line) for the past 30 days.

The chart below gives us a look at Bitcoin's % increase/decrease open to open (red line), % increase/decrease high to high (yellow line), % increase/decrease low to low (green line), and % increase/decrease close to close (blue line) for the past 30 days.

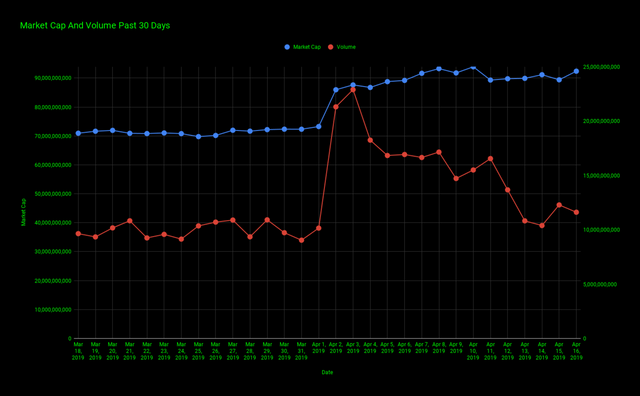
The chart below gives us a look at Bitcoin's marketcap (blue line) and Bitcoin's volume(red line) for the past 30 days.

Hi @cryptonite-elite please follow @phobia I wish to share trading ideas
Downvoting a post can decrease pending rewards and make it less visible. Common reasons:
Submit