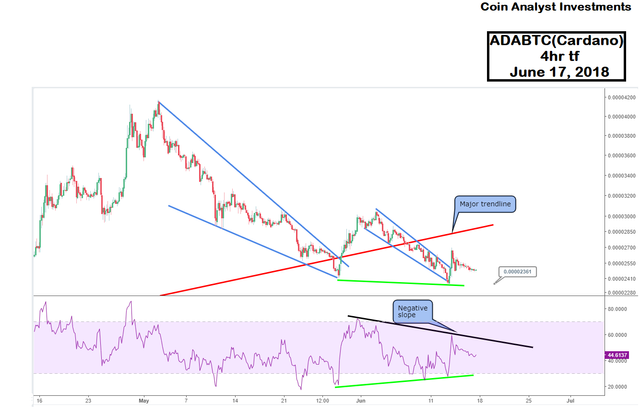
The breach of the long term trendline of Cardano (ADABTC) on May 28, 2018 was temporary with price action closing back above the trendline. A successful test of the trendline was invalidated on July 07, 2018 with price action closing back under the trendline and currently consolidating. This implies continuation of the current downtrend in Cardano (ADABTC).

However, the relative strength index (RSI) indicates a bullish divergence with price action (shown by green lines on price action and RSI) which suggests the loss of bearish momentum. A negative slope also indicated on the RSI does suggest continuation of the current bearish momentum in Cardano (ADABTC).
Due to conflicting signals, it is best for one to have patience and not jump into conclusions concerning the next major move in the price of Cardano (ADABTC).No bullish trade should be considered however until Cardano (ADABTC) closes back above its major trendline and is confirmed or supported by bullish momentum.
Price closing back below ~0.00002361 could see Cardano (ADABTC) test support (not shown here) between ~0.00001387 and 0.00001068. Lower support on further move to the downside is also present between 0.00000641 and 0.00000524. The battle lines are clearly drawn for Cardano (ADABTC )...which side are you on?
Join Our Premium Research and analysis group: