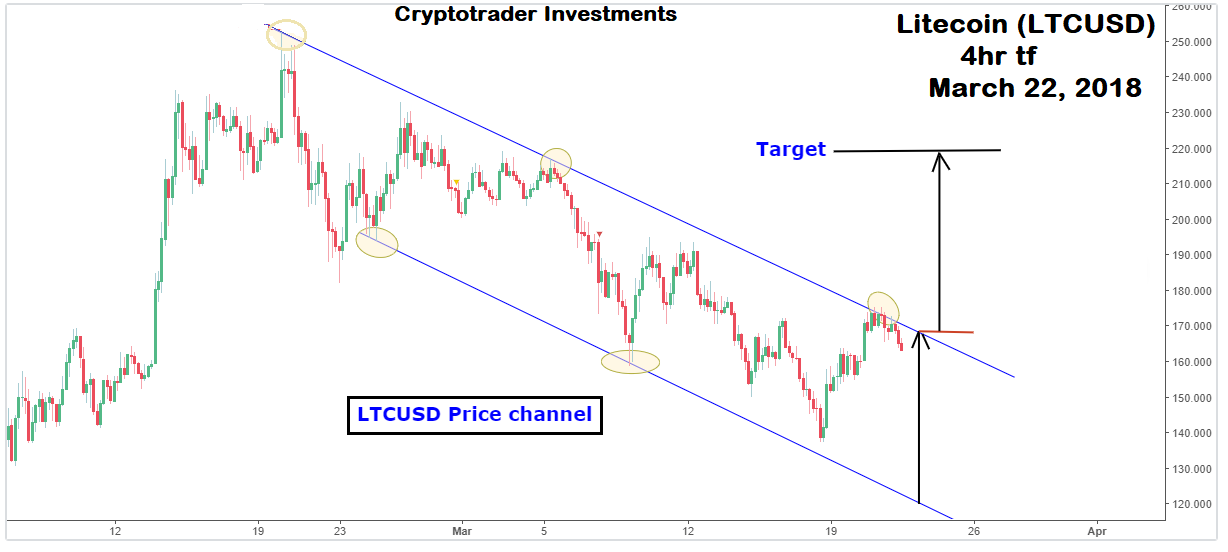
Litecoin has been meandering ever since it hit a high of ~$252.86 on Feb. 20, 2018. A price channel has been used in this analysis to capture price movement for Litecoin since the above mentioned date.
The upper channel line was drawn to touch previous highs (at least two) and a parallel line was then drawn across price lows (also at least two since a valid trendline requires two points of contact).

A breakout above the upper line of the channel could the see price of Litecoin reach a target of ~ $220.67. This is calculated by vertically projecting the width of the channel onto the break out point. I used $120.29 as the bottom of the channel and $170.48 as the top of the channel here. Therefore $170.48 - $120.29 = $50.19. Adding this to the too ($170.48) gives $220.67.
Failure to close above the channel could see Litecoin return to the bottom of the channel at ~$120.29