My previous post on OMGUSD (4hr tf) can be found here:
https://coinanalyst.investments/2018/05/15/omisego-omgusd-wave-analysis-4hr-tf/
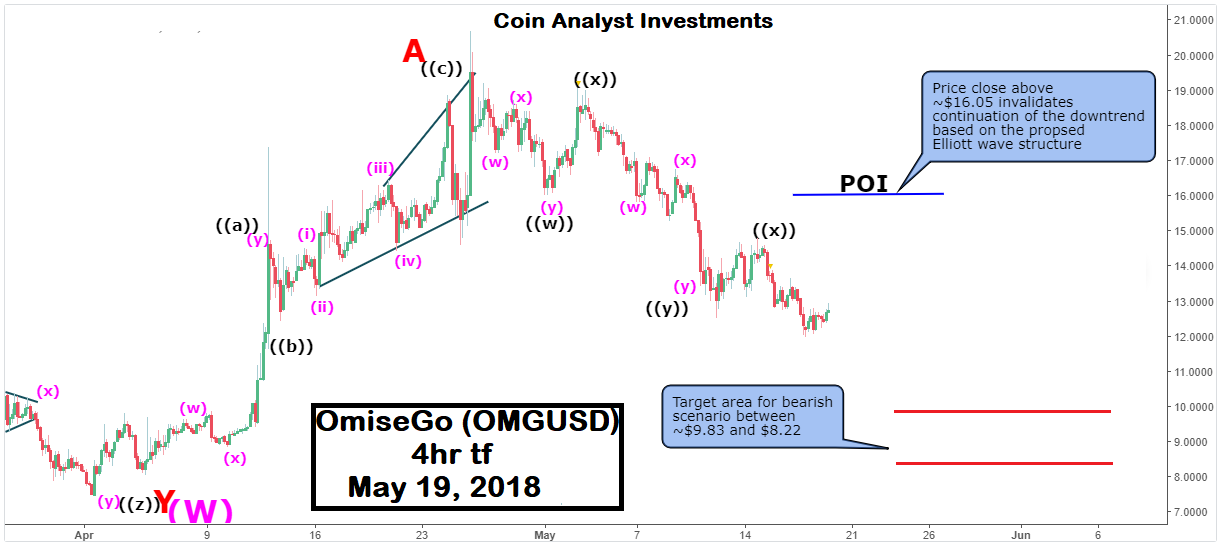
It was mentioned in the previous post that a price close below ~$12.50 favored a bearish scenario for OmiseGo (OMGUSD). Price swing downwards from ~$17.82 on April 26, 2018 is therefore identified in this analysis to be a triple zigzag Elliott wave structure (W-X-Y-X-Z) that is not yet complete as we are in the last leg of the structure i.e. Wave Z.

The horizontal red lines on the chart from the previous post mark the region that is still favored for the termination of wave Z, before any bullish momentum can be sustained by OmiseGo (OMGUSD).
The point of invalidation (POI) of this analysis is a price close above ~$16.05 at which point OmiseGo (OMGUSD) would have invalidated the proposed Elliott wave structure.
Very well written analysis :)
Downvoting a post can decrease pending rewards and make it less visible. Common reasons:
Submit
Thanks a lot and I do appreciate it:-) You can read more on the blog page of my website as referring to a previous post helps make whatever current analysis you are reading easier to follow. Besides, feel free to share in it your social media if you do enjoy the posts. I hope you enjoy the rest of your day.
Cheers
Downvoting a post can decrease pending rewards and make it less visible. Common reasons:
Submit