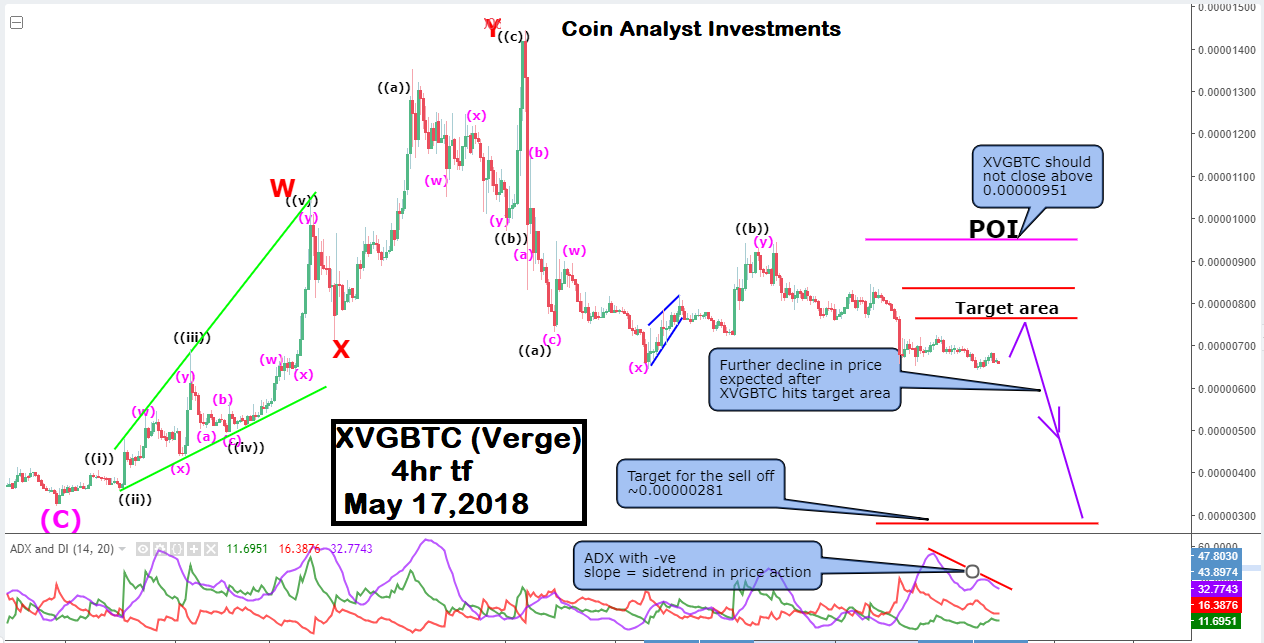
Price action from ~0.00001419 on April 17, 2018 till present date is identified in this analysis as an ongoing corrective (3 wave) move for Verge (XVGBTC) that not yet complete. The downtrend is described here as a possible zigzag Elliott wave structure. A minute wave ((c)) of the structure (last leg) that is currently ongoing should see the price of XVGBTC further decline.
The earliest price target for XVGBTC based on the zigzag structure for minute wave ((c)) is ~0.00000524 or 0.00000281 at which point minute wave ((c)) would = 100% minute wave ((a)).
Any upward move in the price of Verge (XVGBTC) should find resistance at the target area shown on the chart (between ~0.000000836 and 0.000000765).

The ADX as shown here with a negative slope indicates a consolidation or sidetrend in Verge (XVGBTC). Patience is therefore required to see how price action further transpires as opposed to selling immediately.
The point of invalidation (POI) for this analysis is a price close above ~0.00000951, which is just above the high of price on May 3, 2018 at ~ 0.000000945.