There was something important missing in the cryptocurrency market until now… a cryptocurrency volatility index!
Very recently, the volatility index VIX has been very topical. Indeed, the Cboe Volatility Index (ie. developed in 1986 and going up when investors are nervous while low when they are not) was historically low in 2017. About three weeks ago on Feb. 6, its level skyrocketed above 50 for the first time since August 2015. This boom coincided with the worst week for the US stock market in many years. Even though, it has now come back to 18.90, it still remains way above its one-year average daily level of 11.70.
The VIX is a very significant tool in the stock-investing world and an index that investors need to constantly gauge.
A Volatility Index was missing in the crypto world, that’s why CVX was made
The CRYX Cryptocurrency Volatility Index (CVX) was developed by CRYX in 2017 to find a VIX equivalent in the cryptocurrency space. Futures on cryptocurrencies are not yet fully available thus another method needed to be found.

The CRYX Cryptocurrency Volatility Index, known by its ticker symbol CVX, is the standard measure of the cryptocurrency volatility. It is commonly referred to as the “fear index”.
Its calculation is relatively simple.
The CRYX Cryptocurrency Volatility Index (CVX) is aiming to measure the volatility of the top 50 cryptocurrencies over a 3 weeks rolling period. The CRYX Cryptocurrency Volatility Index also integrate CRYX’s “FLEX” weighting methodology in other to smooth the market values from the top 50 cryptocurrencies and allow a better overall impact of each cryptocurrency volatility. Momentum based theory could apply to the CRYX Cryptocurrency Volatility Index calculation and it might be able to determine expected future volatility of the cryptocurrency market.
How exactly is CVX calculated?
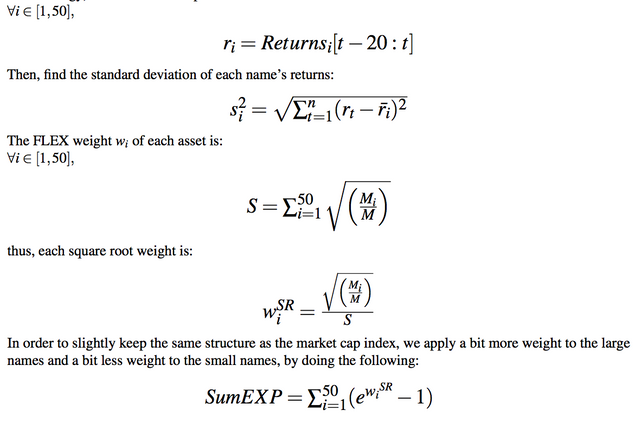
The way CVX is calculated is by taking the 21-days rolling standard deviation of the largest 50 market capitalizations that have been weighted according to the exponential of the square root (i.e. the FLEX methodology) of their market capitalizations.
As taken from CRYX White Paper (link), the methodology is the following:


How to interpret it ?

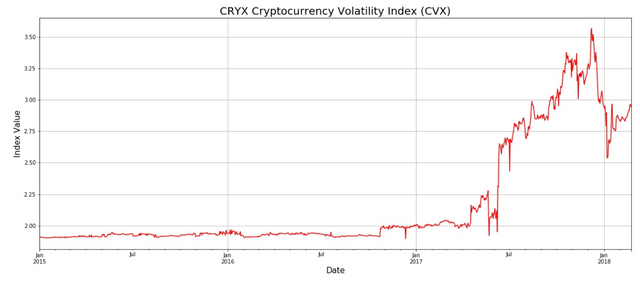
The calculations and methodology behind the index can look rather complicated to non-expert, however the CVX can be graphically analyzed relatively easily.
When the index value goes up, volatility over the past period has been higher than from the previous calculation point, and expected near term volatility should be potentially increasing. When the index value goes down, volatility over the past period has been lower than from the previous calculation point, and expected near term volatility should be potentially decreasing.
Let us take a concrete example from the current CVX Chart available on our Alpha platform. The CVX as of Jan 1st 2017 was 2.01, a year later it was 2.98. Even though the cryptocurrency market has relatively evolved in this one-year gap, volumes have increased and daily trading is larger, the volatility itself has also gone up generally. Comparing this point really says that the 30 days volatility of the top 50 cryptocurrencies before January 18 was 48% higher than the 30 days volatility of the top 50 cryptocurrencies before January 2017.
“The CRYX Cryptocurrency Volatility Index (CVX) is relatively simple to understand and simple to interpret. Investors in cryptocurrencies were undoubtedly missing this significant information. Most of them wanted to have a quick snapshot of how volatile the crypto market was, is and is likely to be.” said Olivier Al-Khatib, Chief Data Scientist of CRYX
If you are more interested in the CRYX Project as a whole, feel free to visit the CRYX’s website: cryx.io
LinkedIn: https://www.linkedin.com/company/cryx/