Watching as this current situation plays out. We have the opportunity to move pretty far in either direction depending how the market plays out.
Right now we are trading inside of a fairly tight range.
Support at 6627
Resistance at 6848
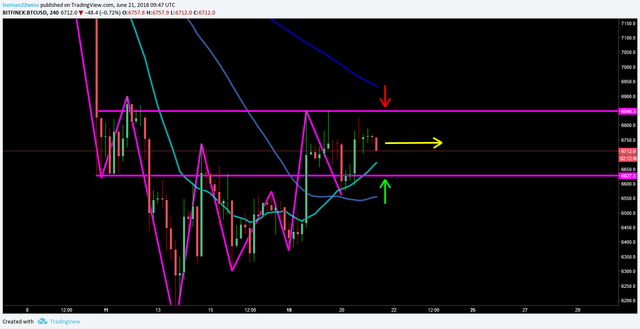
I think for the most part the market should remain fairly uneventful for the time being. 4 hour chart EMA's are pushing both down and up on the price. For the most part I expect any major dips will be bought up, and any movement to the upside should also sell off.
Things to watch today:
Watch for the daily candle closing. If the price remains above the 20 EMA (Light blue) on the four hour chart (above), this will result in a very bullish inside bar forming on the daily chart highlighted below.
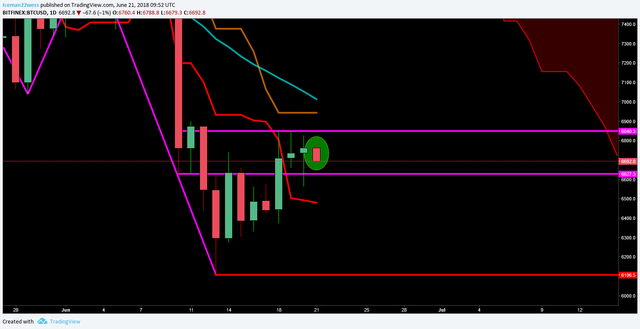
While I don't think this has a great chance at succeeding, it's something to keep an eye on, none the less.
Next up is the support and resistance. I don't think much will happen today, but perhaps in the next few days this will come to pass. It is important to watch for the support and resistance levels to have breaks. Even tests of these levels will only make these levels more significant on the breakout or breakdown.
Words of caution. If either of those two events happen in the very near future, it will run into EMA's that should shut it down pretty quick.
The ideal breakout pattern I am watching for is still a few days away. It would look something like this.
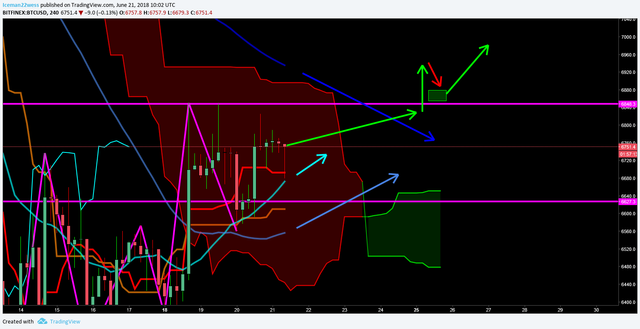
If we can cross above the 100 EMA (Dark blue) while also being below the resistance level at 6848, this would set the stage for a favorable breakout pattern to watch for. I think any breakouts before that will ultimately retrace back into the trading range until these EMA's have squeezed more. I am still undecided about this though because the down trend is so hard that playing a breakout is still not really a great trade. I will explain. Say the pattern ends up something like this.
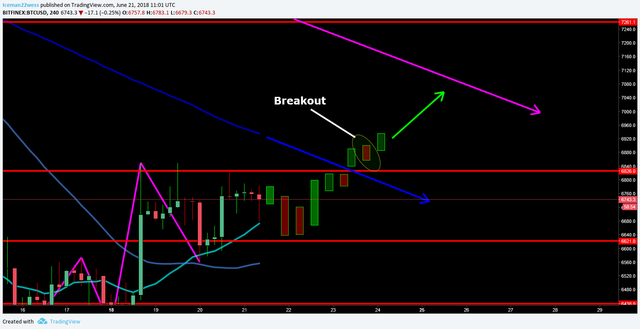
While this would be a valid break out, the 200 EMA would not be far away, and likely to reject off of it, leaving little room for gains, while the 100 EMA is down trending and leaving even more room for larger pullbacks. More so, I want to point out a similar situation that happened not too long ago on the 4 hour chart. My suggestion here is to be careful and not get trapped in a false breakout.
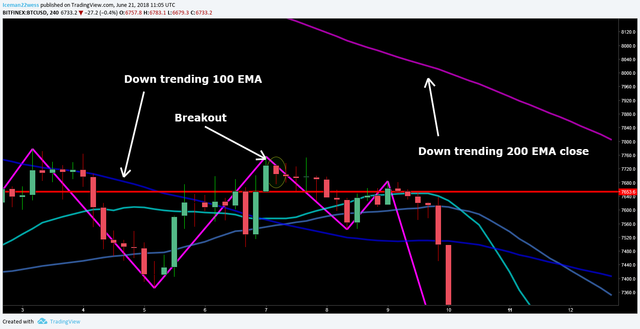
With all that being said, little to no massive movement is expected in the price. In that case, I am willing to check out smaller time frames for trading opportunities within our range.
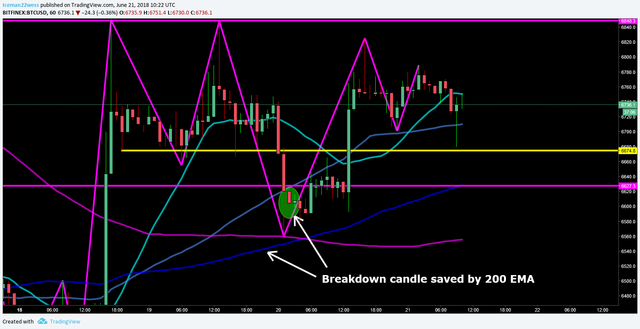
Notice how our local support level in yellow breaks down, and the 100 EMA (Dark blue) provides support to end the pattern before it starts.
The Trend is currently in a lower high, lower low pattern on the hourly.
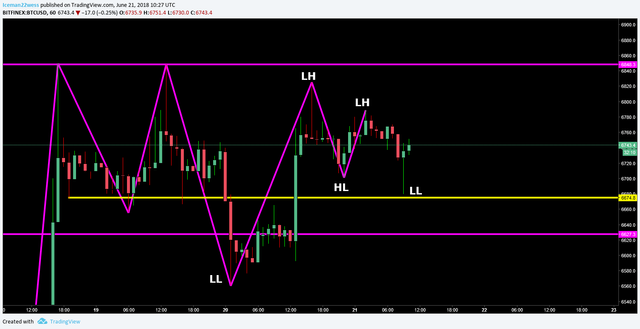
Even on the hourly, I would remain for the most part, idle. Should the price reach either extreme of the support/resistance, it's possible to play those in the opposite direction but may not be the perfect trade set up so scaling in small and slow would be a must.
Thanks for reading,
-Icee-
Please leave me an upvote and remember this is not trading advice.
Resteemed by @resteembot! Good Luck!
Check @resteembot's introduction post or the other great posts I already resteemed.
Downvoting a post can decrease pending rewards and make it less visible. Common reasons:
Submit
Good post, thanks for sharing it
Downvoting a post can decrease pending rewards and make it less visible. Common reasons:
Submit