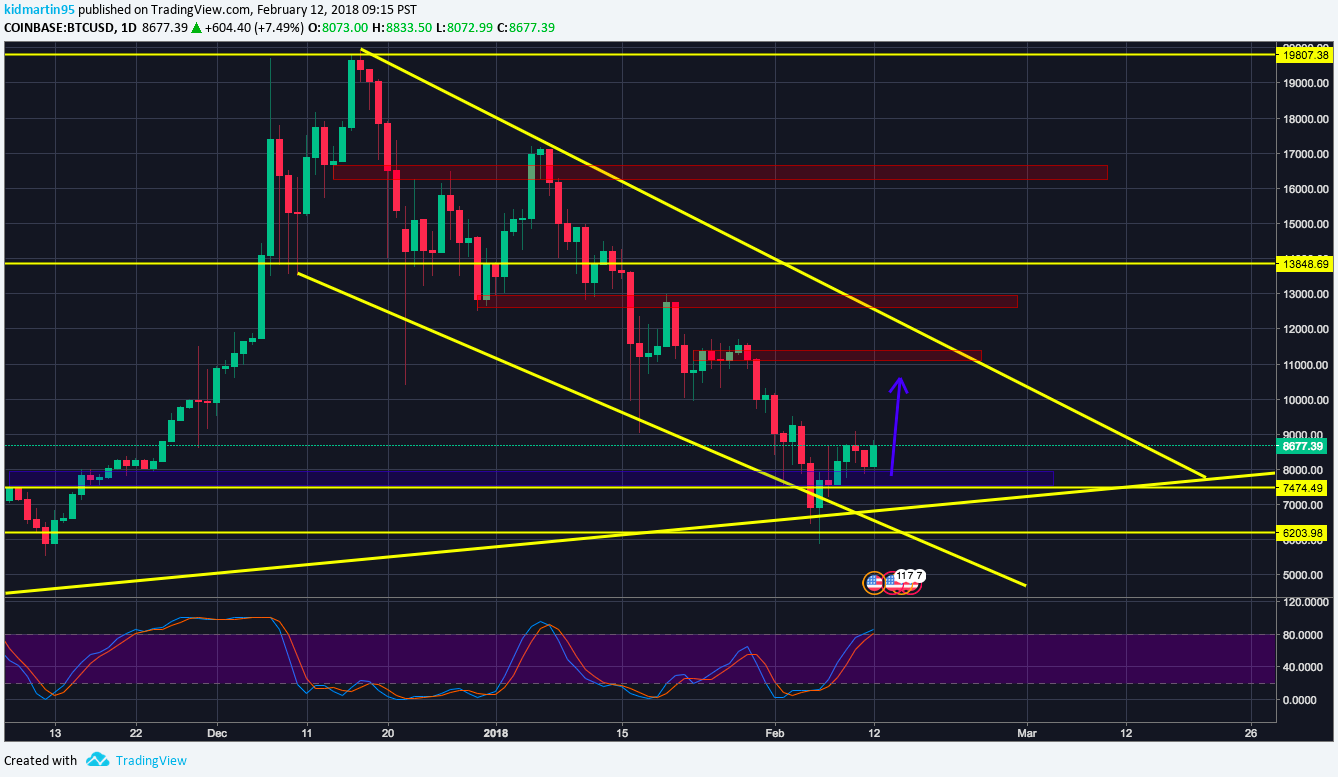

Daily Chart
Showing us a possible bullish engulfing candle, indicating support has been found. Still testing bottom of our channel.

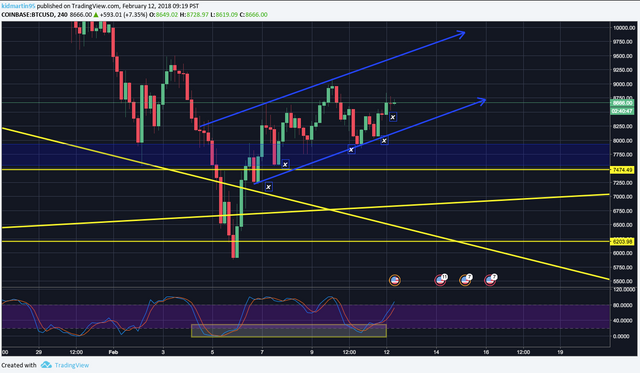
4Hour Chart
Showing price respecting bullish parallel channel. "x" = higher lows being formed. Expecting a push towards $9,000 zone.

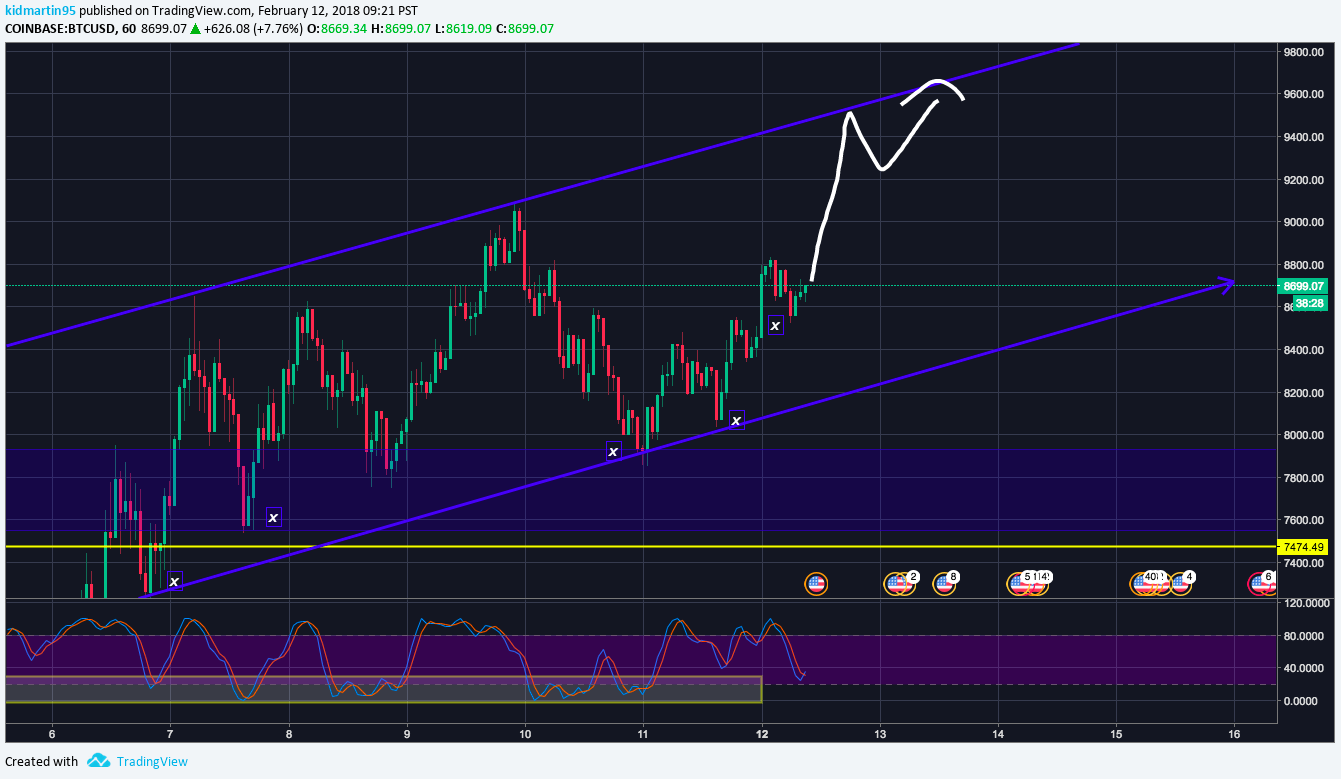
Hourly Chart
Showing us a possible leg extension towards $9,500 zone. Looks like a good time to buy the dip.
Comment Down below what coin you want me to do next! ;)
Thank You for Your Support, Upvote and Follow!!! New Blog and Video everyday
Social Media:
Twitter: https://twitter.com/KidMartin95
Instagram: https://www.instagram.com/kidmartin95...
InvestFeed: https://www.investfeed.com/kidmartin9...
Disclaimer: I am not a financial advisor nor am I giving financial advice. I am sharing my biased opinion based off speculation. You should not take my opinion as financial advice. You should always do your research before making any investment. You should also understand the risks of investing. This is all speculative based investing.
good analysis, I couldn't do charting or reading indicators, you could do it so well. Come and visit my blog if you wouldn't mind, I have same interest with you but in different perspective. :) Thank you for sharing the good analysis.
Downvoting a post can decrease pending rewards and make it less visible. Common reasons:
Submit