Monday 5/3/2018
I saw this chart in a vid by Datadash on Youtube and compared it to btcusd....
Here is the chart, called the Wall Street Cheat Sheet
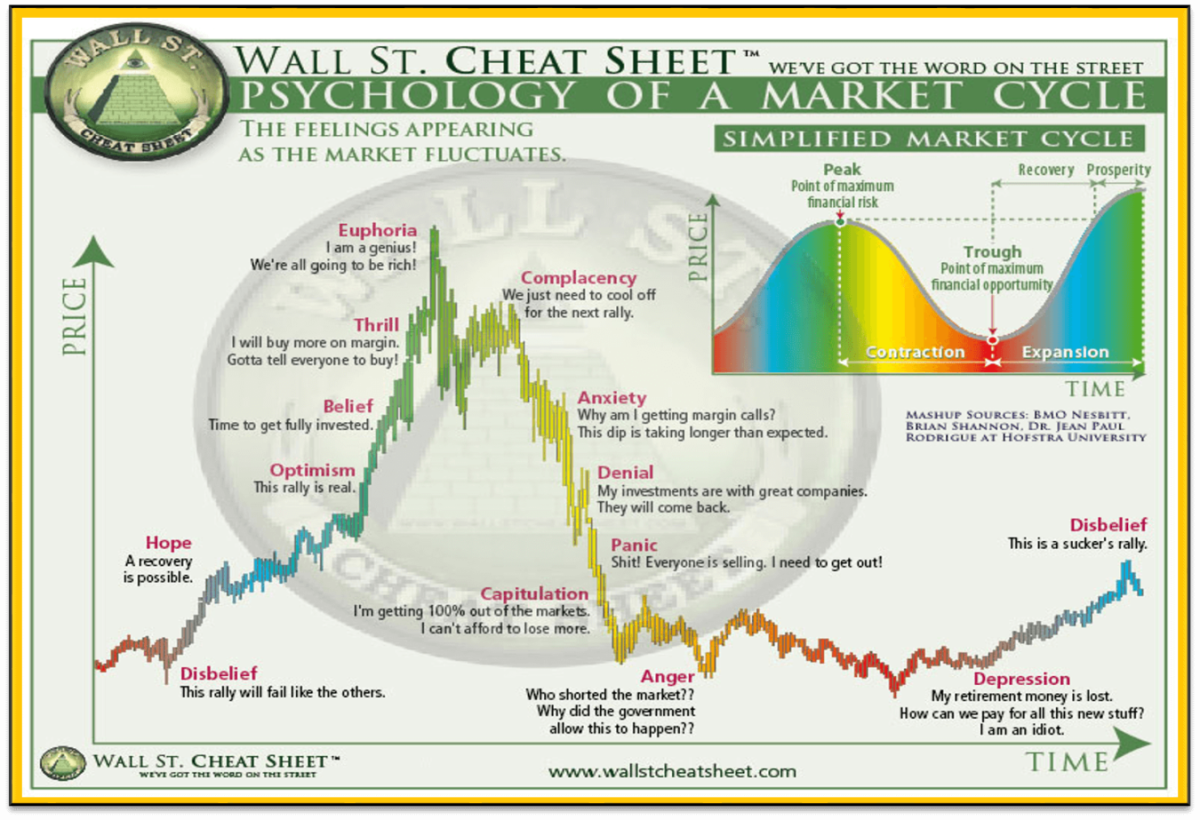
And now bitcoin daily price overlayed and normalized over this....
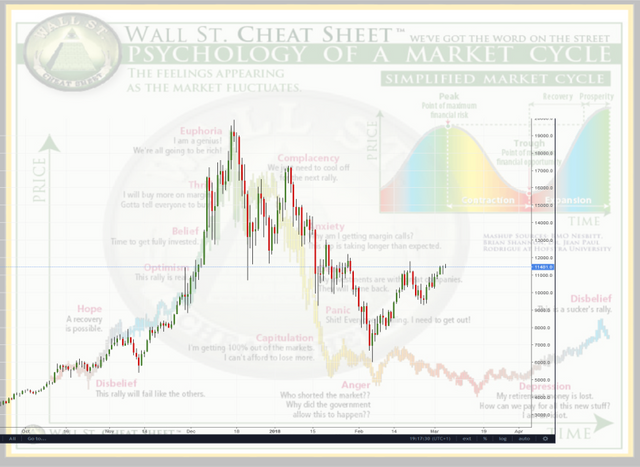
it may be hard to see in the image, but it is jan2018 right in the middle, and the extremities are oct17 and apr18
No more explanation required
Looks like this is still holding, good work.
Downvoting a post can decrease pending rewards and make it less visible. Common reasons:
Submit
Thanks
Downvoting a post can decrease pending rewards and make it less visible. Common reasons:
Submit