Today we're going to highlight bullish divergence. What is that?
A bullish divergence forms when OBV moves higher or forms a higher low even as prices move lower or forge a lower low. A bearish divergence forms when OBV moves lower or forms a lower low even as prices move higher or forge a higher high. The divergence between OBV and price should alert chartists that a price reversal could be in the making.
[from Stockcharts: "On Balance Volume (OBV)"]
So, for instance, if a large buyer buys a whole lot of an asset on Monday, so that the price chart shows a green candle and the volume chart shows a large green bar, but over the next 4 days smaller sellers push the price down (resulting in red candles with very small volume bars), you may have OBV largely unaffected by the small volume sells.
This is a situation where, if the large buyer returns to the market and makes another one of his buys, the price could easily return to its Monday levels.
Of course, the large buyer is not guaranteed to ever trade again, but trading is about probabilities, not certainties.
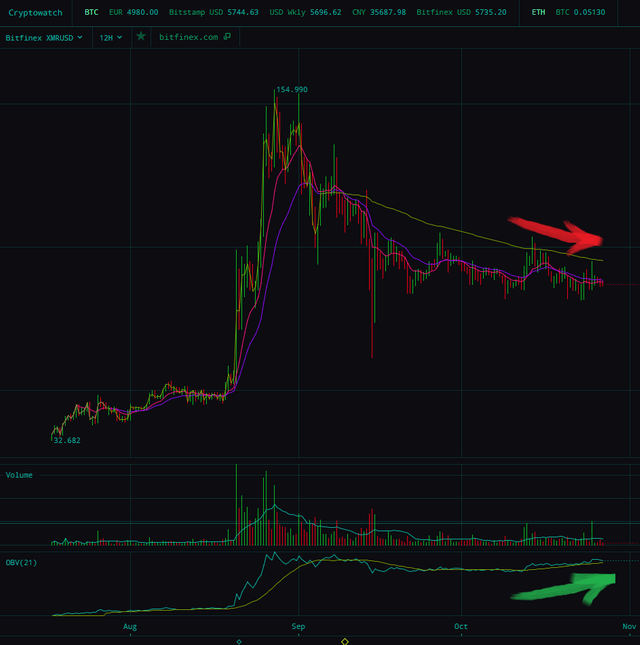
So let's bring up the XMR/USD 12-hour chart from Bitfinex:

The red arrow indicates our declining price, and the green arrow indicates the rising OBV. This can be further corroborated by checking out the Volume bars: the price rises occurred under big volume (large green bars) and the falls occurred under medium-to-small volume (small red bars).
This sets up a bullish divergence-- if one of our buyers from early September should return, they would quickly eat through the order book (the Monero for sale on exchanges) and push the price to previous highs!