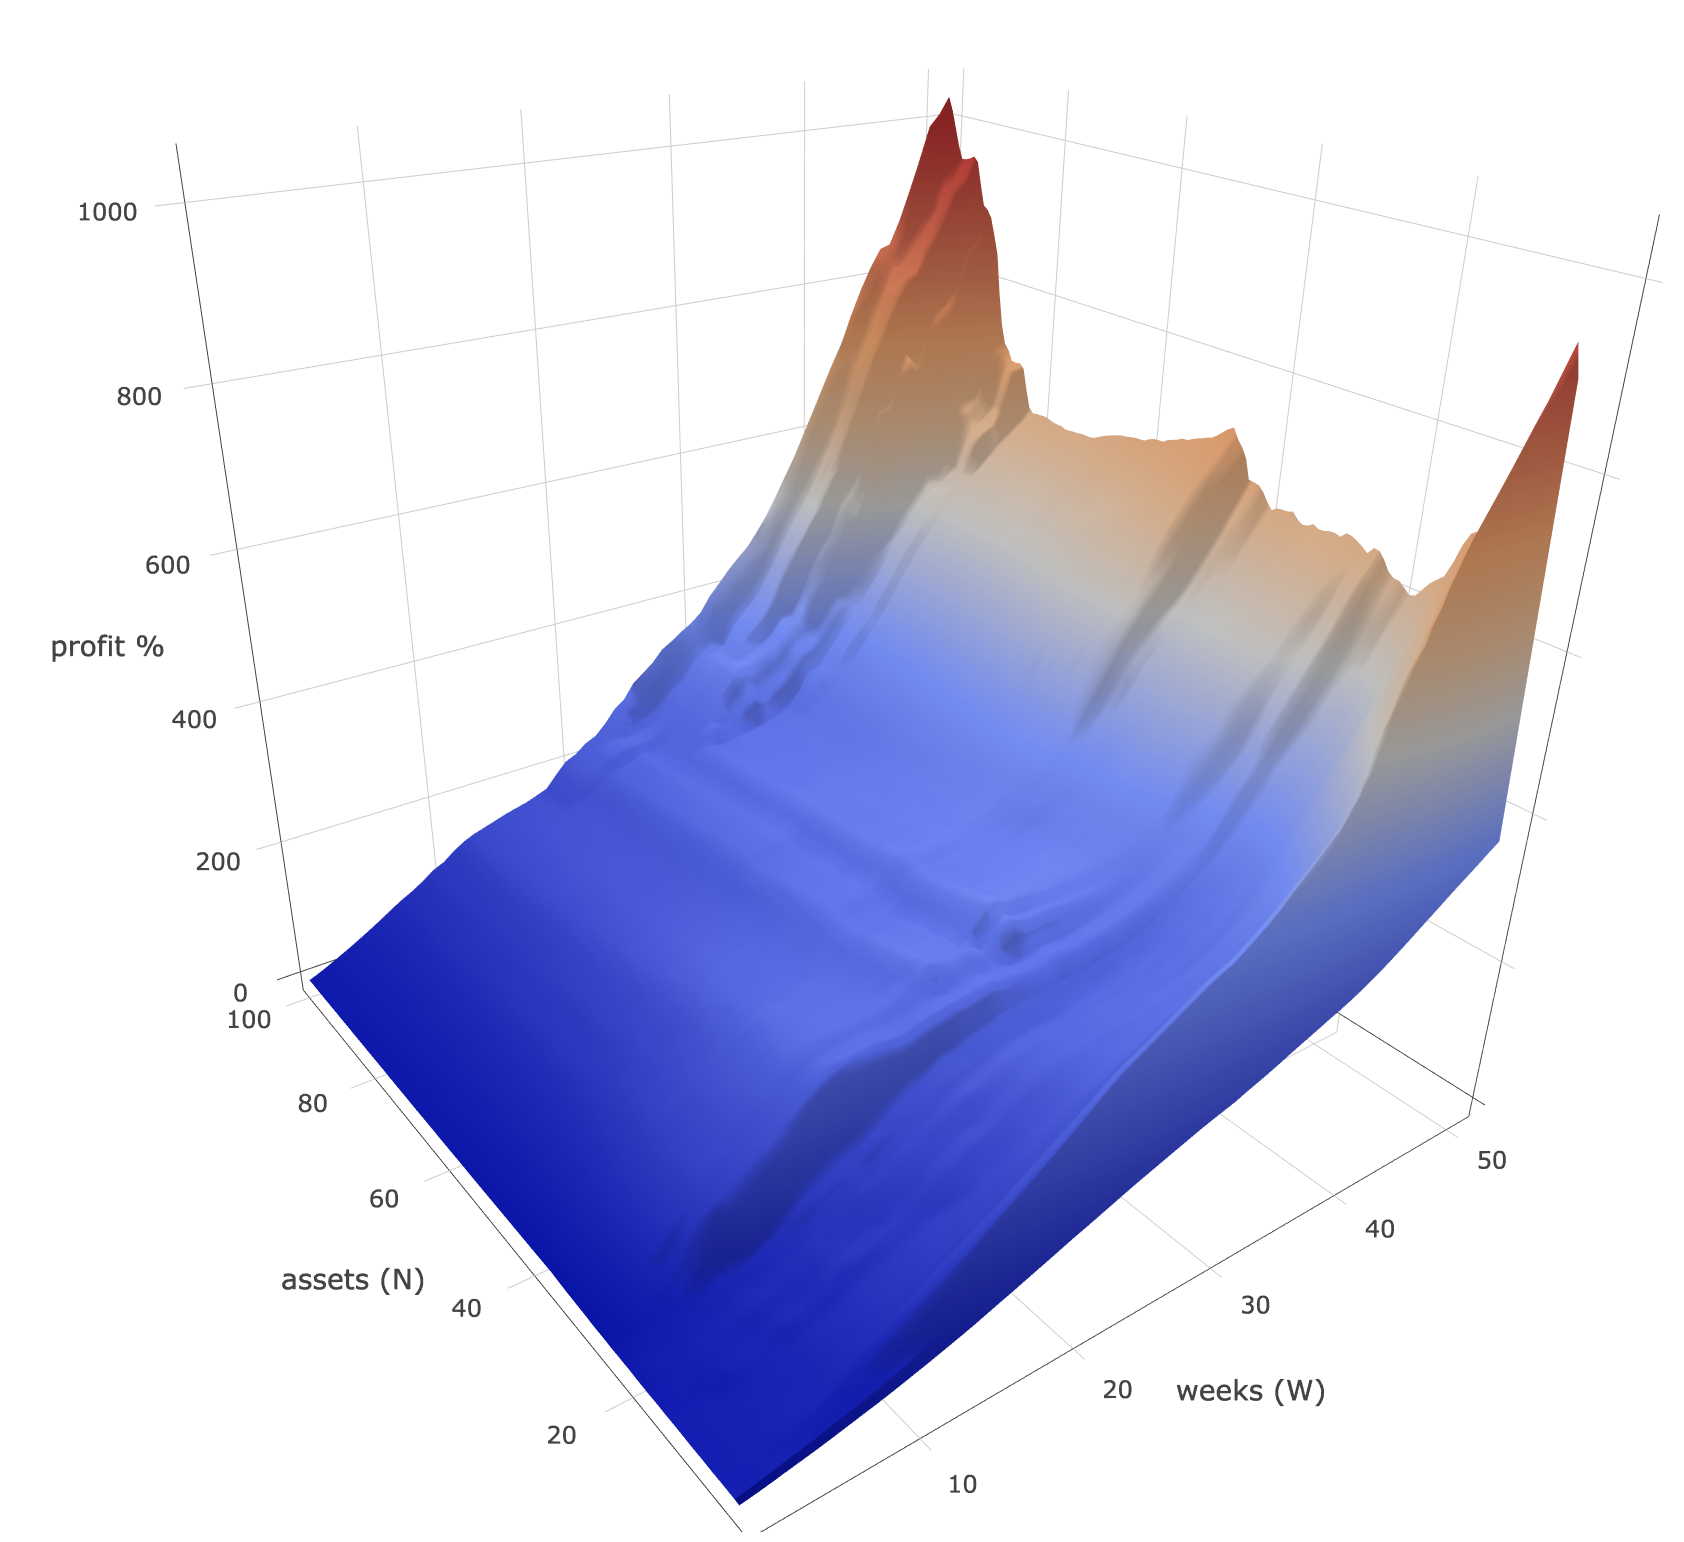
I've done more simulation and now you can see the results more visually in 3D :)

It's profit simulation for investing in top N crypto assets equally for W weeks using coinmarketcap.com's historical data. Please read the previous post to see how it is simulated.
You can rotate, zoom to see the graph interactively from https://mix1009.com/crypto/simulation.
The simulation was done for all points for N(number of top assets invested)=1..100 and W(weeks invested)=1..52.
With the growing excitement around cryptocurrencies I thought I would give it a go while leveraging the same strategy. Every month I would invest about 5% of my total 20% into a range of cryptocurriencies — primarily bitcoin, etherium, litecoin, dash and a few altcoins.
Great project done brother
Downvoting a post can decrease pending rewards and make it less visible. Common reasons:
Submit
Looking at the data, I think investing in TOP 5-10 coins long term is a good strategy combined with dollar cost averaging. I'm too much into crypto now.I don't have too much left to invest which I can live without.
Downvoting a post can decrease pending rewards and make it less visible. Common reasons:
Submit
Wow @mix1009
3D chart really cool..Great work
..
i appreciate with you
Downvoting a post can decrease pending rewards and make it less visible. Common reasons:
Submit
I was really pleased with the interactive 3d chart :) Since I only had to prepare the format of data, it was not hard. Plot.ly (graph library) does all the magic.
Downvoting a post can decrease pending rewards and make it less visible. Common reasons:
Submit
Very cool mix, 3d charts are awesome. What software did you use for this graph?
It is pretty exciting times for crypto right now. Feels nice to have a bull run after that long bear run we had.
Hold strong.
Downvoting a post can decrease pending rewards and make it less visible. Common reasons:
Submit
I thought there would be 3d chart support from Google sheets, but it wasn't there. I also tried using Numbers(Apple's spreadsheet app) but 3d graph wasn't so good. So I googled and found plot.ly . It's really easy to use and it's more accessible because it's an interactive web page. I pasted the code from the code example and generated the data(csv) file in the right format.
Downvoting a post can decrease pending rewards and make it less visible. Common reasons:
Submit
More simulation graph for N(assets)=1..200 . The data says investing in 200 assets generates higher profit. But I think it will not be easy for average ppl to invest so diversely and manage the wallets safely.
http://mix1009.com/crypto/simulation/all_200.html
Downvoting a post can decrease pending rewards and make it less visible. Common reasons:
Submit
Simulation of recent data (2017 July-2018 April):
https://mix1009.com/crypto/simulation/2017.html
Downvoting a post can decrease pending rewards and make it less visible. Common reasons:
Submit