
About Pundi X:
The goal of Pundi X (NPXS) is to use of cryptocurrency in a form of payment in real use cases for consumers and retailers. By applying the technology to real world use such as cards and the XPOS point-of-sale devices, the team of NPXS has built different products that for accepting the NPXS token for different services and products. With the aim to support intelligence retail, marketing & loyalty programs and inventory & systems of order management, the Pundi X Point of Sale device can support digital commerce worldwide.
The technical analysis of price:
The Pundi X is ranked at 93 out of more than 2300 cryptocurrencies worldwide at the moment.
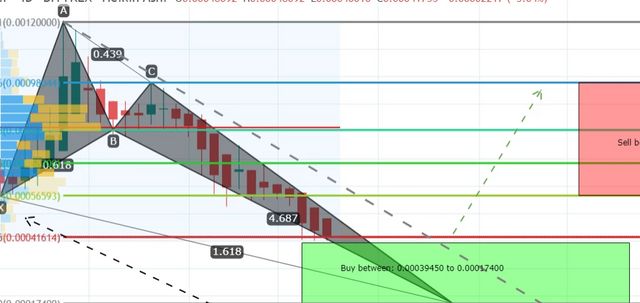
The price action has formed a bullish Crab pattern on 4 day long term chart After initial leg the A to B leg is retraced between 0.382 to 0.618 Fibonacci and A to B leg's projection is moved from 0.382 to 00.886 Fibonacci and formed the C leg then D leg is retraced between 1.27 up to 1.618 Fibonacci level and completed the bullish Crab pattern.
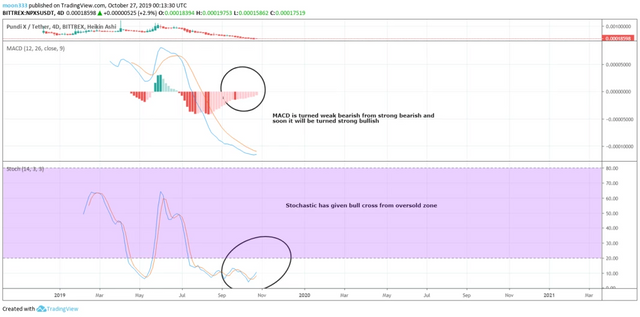
Stochastic has given bull cross from oversold zone and MACD is turned weak bearish from strong bearish and soon it will be turned strong bullish.
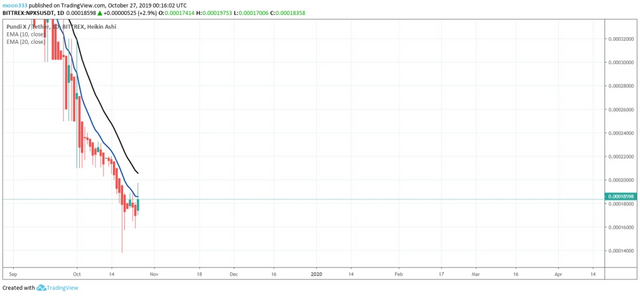
On day chart the exponential moving average 10 is trying to cross down the price action once it will successfully cross down then it can form a golden cross with EMA 20 which will produce more powerful bullish divergence.
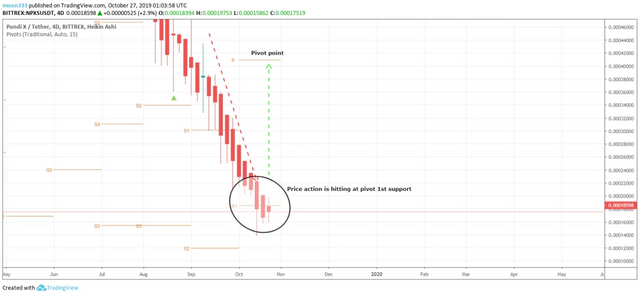
Now back to 4 day chart the price action is hitting the pivot 1st support and likely to fail in breaking down this support so this support can push the price action back to pivot point which is around at 120% up from here.
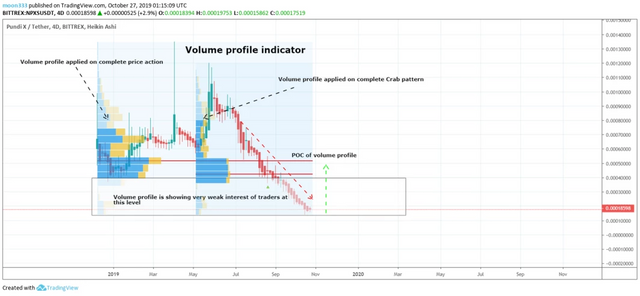
In above figure 1st I have applied volume profile on complete price action of Pundi X then placed the volume profile from the candle stick of May 5 2019 from from where the initial leg of pattern starts both volume profiles are giving same results and we can see so far the trader's interest is not developed at this highlighted area so this can lead the price action to move back to the POC of volume profile and if the price action hits the POC of complete priceline's volume profile then it can give around 175% from here and if the price action move up the the POC of Crab pattern's volume profile then it can give around 125% profit from here.
Now at the end after applying the Fibonacci sequence method on the complete price action of Crab pattern we receive below buying and sell targets:
Buy between: $0.00039450 to $0.00017400
Sell between: $0.00056593 to $0.00098044
Regards,
Atif Akbar (moon333)
Disclaimer: Every word and figure of above article is purely result of my personal research and work you can share it using my reference moreover the information contained in this article is for education purpose only, this is not intended to be investment advice, so please seek a duly licensed professional for investment advice.
You can also find me on these social links:
https://www.tradingview.com/gopro/?share_your_love=moon333
https://www.youtube.com/moon333
https://m.facebook.com/Moontriple3
https://twitter.com/moon33367268705
https://t.me/moontripple3