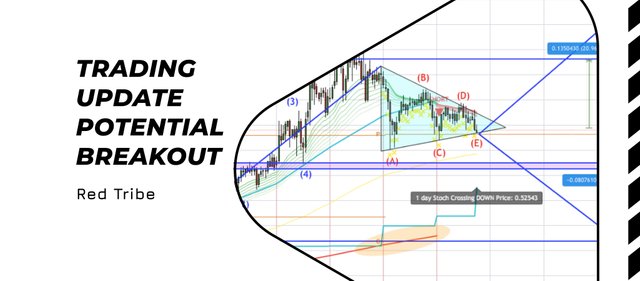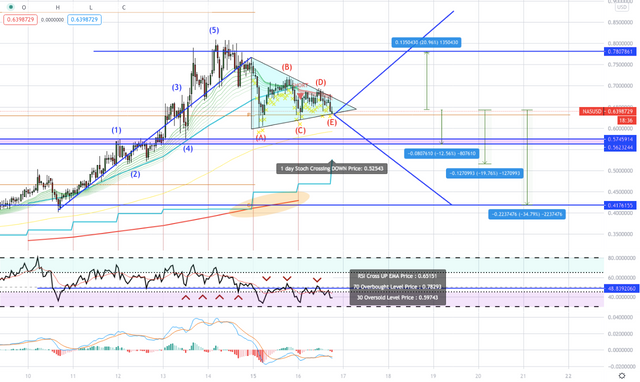
On the hourly chart we now see a NAS/USD triangle formation. The triangle formation most similarly represents a symmetrical triangle as shown below.

After seeing a major impulsive wave, NAS has now formed an (A), (B), (C) , (D), (E) triangle formation as shown above. This triangle can breakout in either direction, therefore if a potential long or short is placed, waiting for a breakout is recommended. However when looking at the RSI/EMA, MACD & EMA ribbons the indicator sentiment is bearish.
Targets
If NAS/USD breaks below the triangle the first target is $0.575 USD. When looking at the EWs, this is the most likely occurrence.
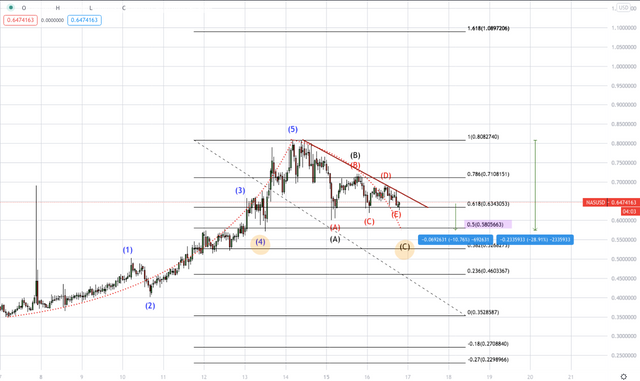
If a corrective wave occurs (shown in black) (A), (B), (C) then the target is (4) from the impulsive wave which is $0.575 USD. This is also in the same zone as the 0.5 Fibonacci retracement. If a fall to this zone occurred, NAS/USD would remain medium term bullish. A fall to this level would be a 10.76% drop.
If NAS breaks out of this triangle in a positive manner, the first target is 0.8 USD. This would be a 100% retracement of the triangle. A move up to $0.8 USD would be a +20% move from our current position. From here, the target after that would be the 1.618 retracement level which is $1 USD.

NAS/USD
Conclusion
In conclusion NAS/USD is waiting for a potential breakout which could lead to price action in either direction due to the type of triangle formation. However there is an increased likelihood of NAS/USD moving down. This is due to certain daily indicators turning bearish, alongside the current EWs. All in all NAS is however looking long term bullish.
As usual this is not financial advice and is for educational purposes only.
Red Tribe free Telegram channel - https://t.me/red_tribe
Red Tribe website - redtribe.xyz