Technical analysis of XRPUSDT from 25th January to date.
Chart: Trading View, XRPUSDT(BITTREX)

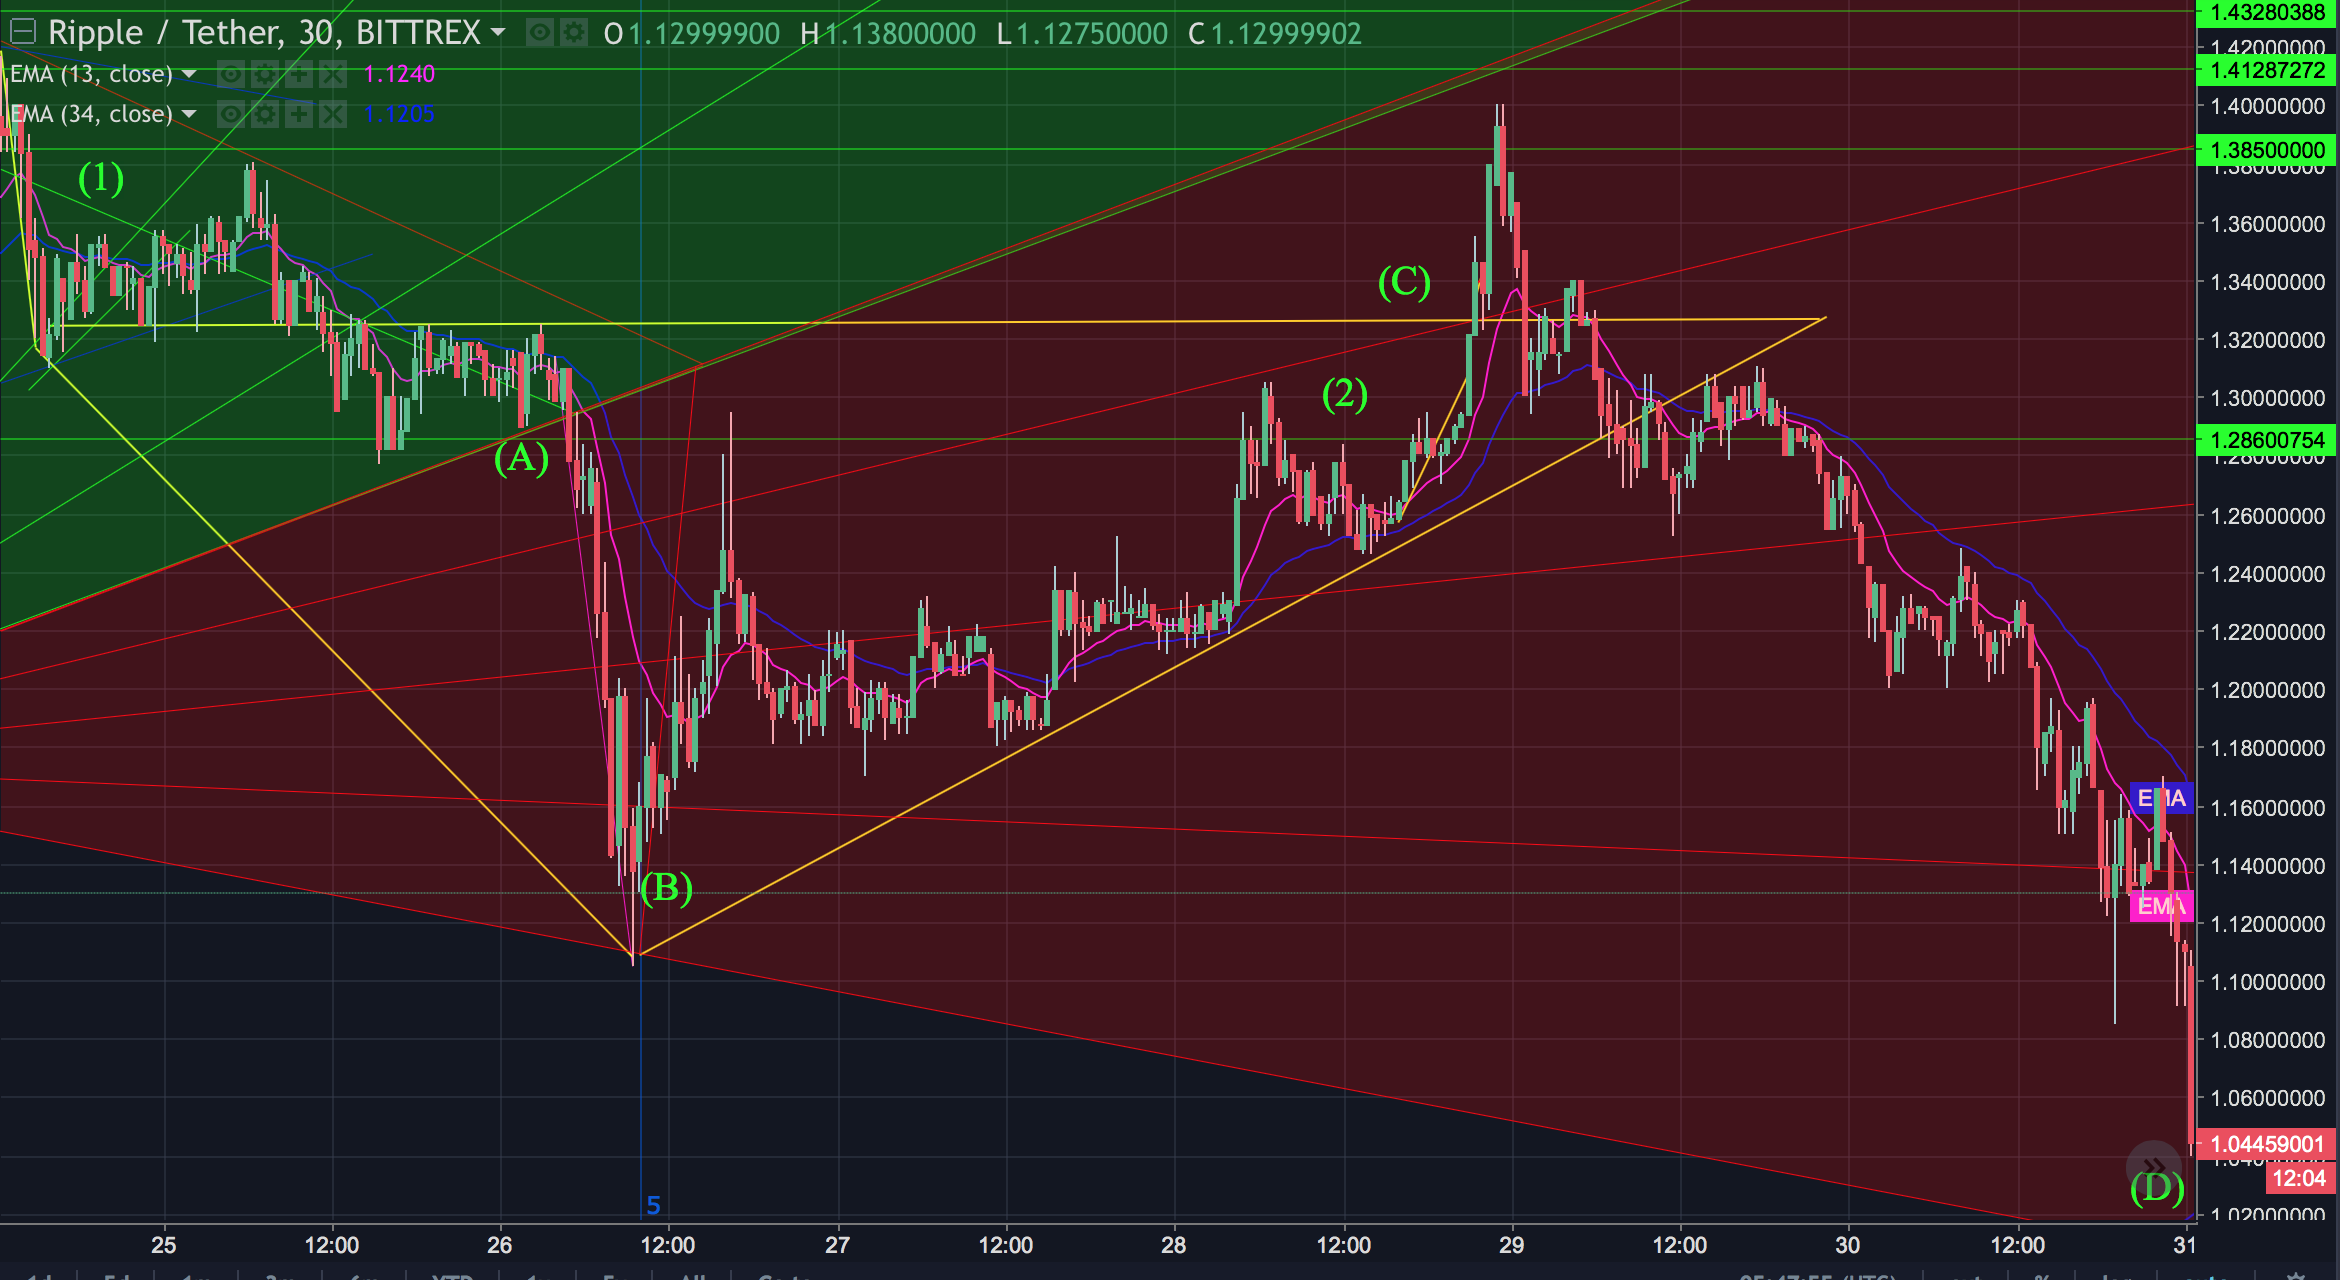
(1) As you can see in the diagram above, there is a descending triangle forming.
(A) Price breaks support and dips below the $1.28 resistance level which clearly indicates that the downward momentum is getting stronger.
(B) The price drops to as low as $1.141, where we see support, thus indicating a good time to buy. We see a price reversal and a definitive upward trend from there.
(2) We then observe an ascending triangle that breaks out at point (C) however it is a false break through and there is a price reversal which takes the market down to (D)
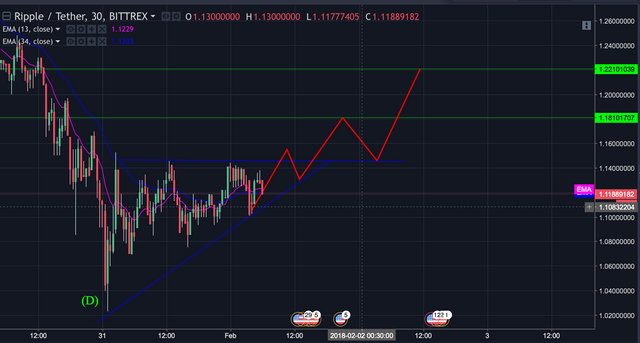
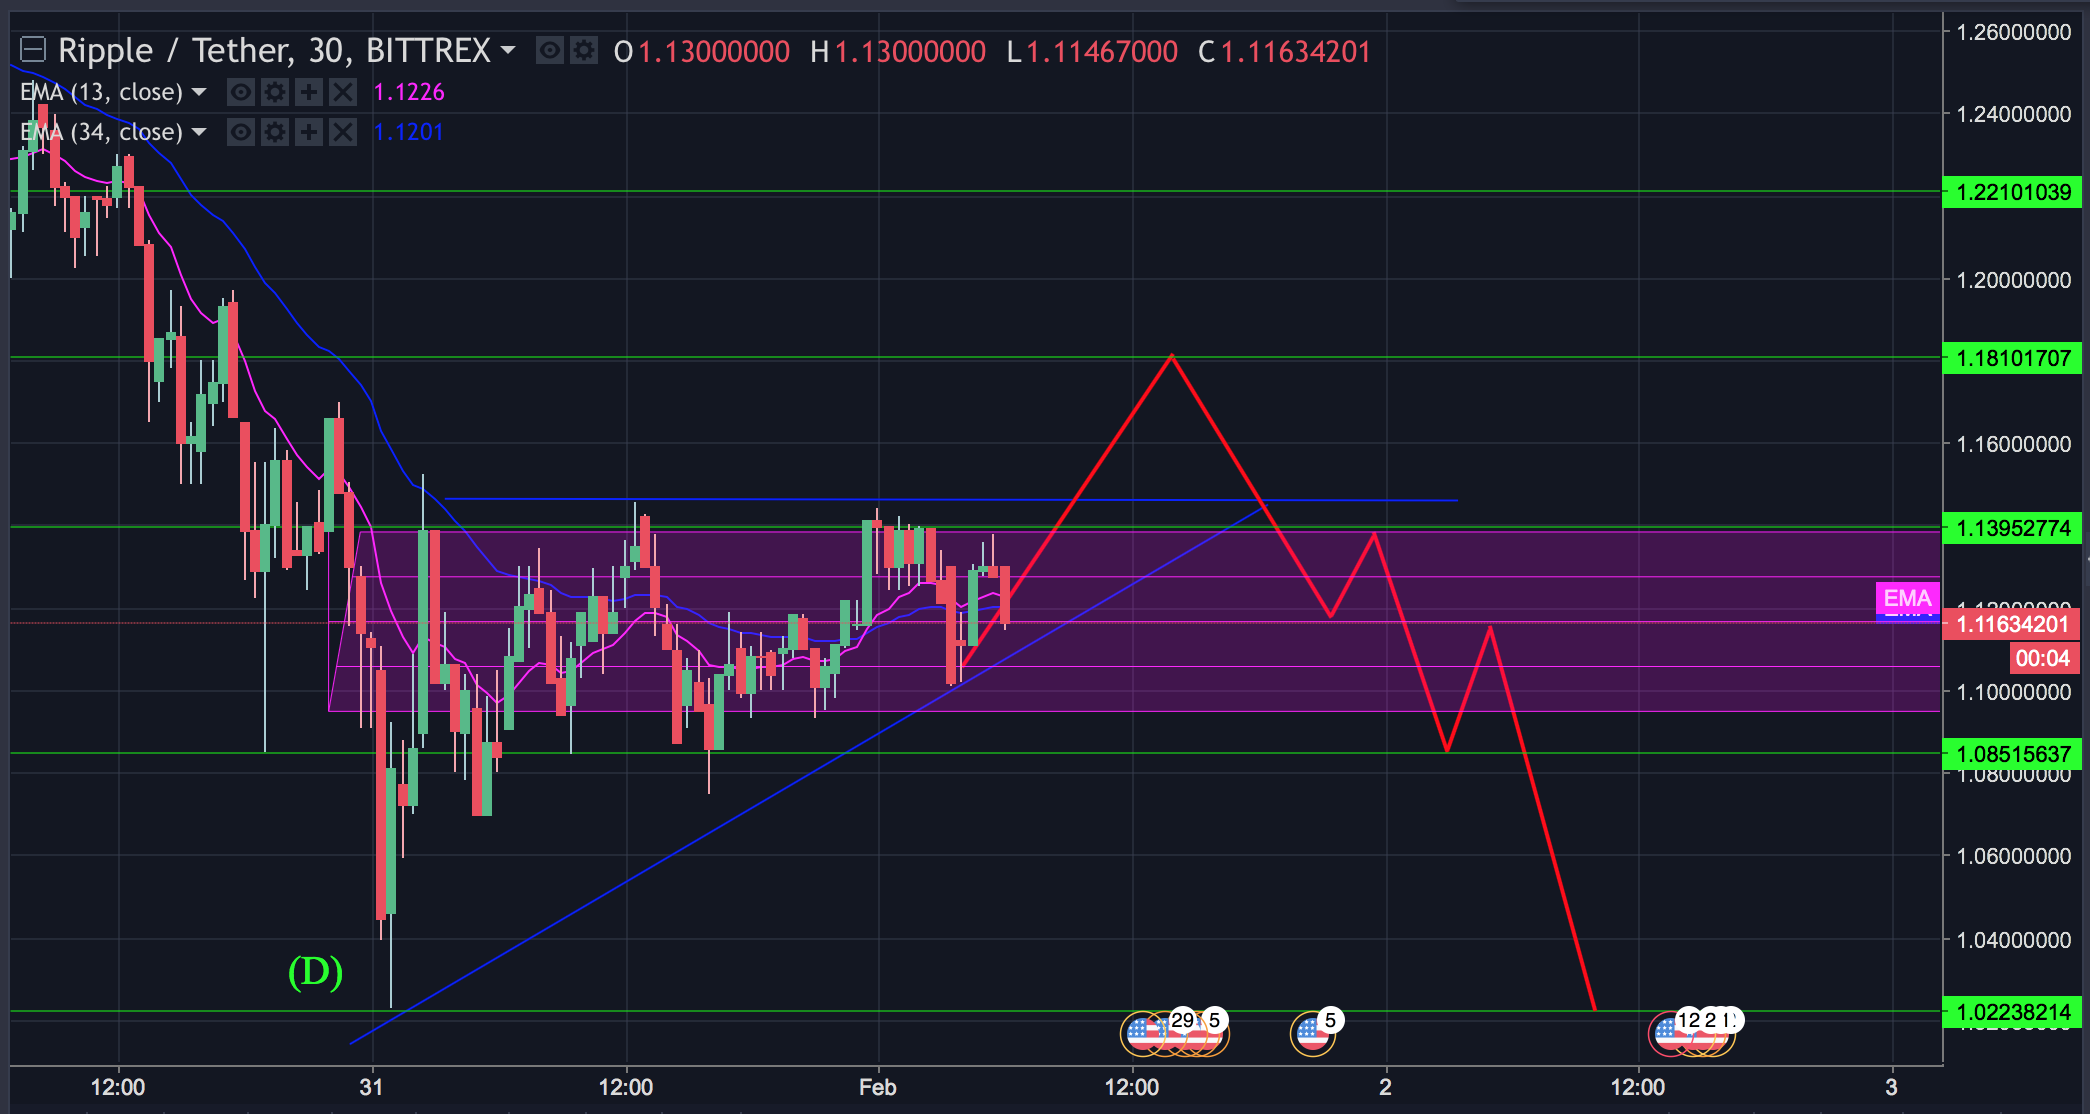
CURRENT PRICE AND FUTURE PREDICTION:
Scenario (1)

Successful breakthrough and upward trend continues despite strong resistance at points viewed in the past.
Scenario (2)

False breakthrough with a price reversal at $1.18
LEGAL DISCLAIMER: This is not financial advice, just my opinion.
For more analysis, comment below on which coins to review and make sure to up vote and share.
Thanks!