Good evening, everyone!
We aren't panicking, right? It's a very easy thing to do when price starts to trend downwards. It's an even easier thing to do when we've invested money we cannot afford to lose. Although, because you are a well-informed individual who has not invested money you cannot afford to lose, you aren't worrying. Right? Right???...
Let's get into it.
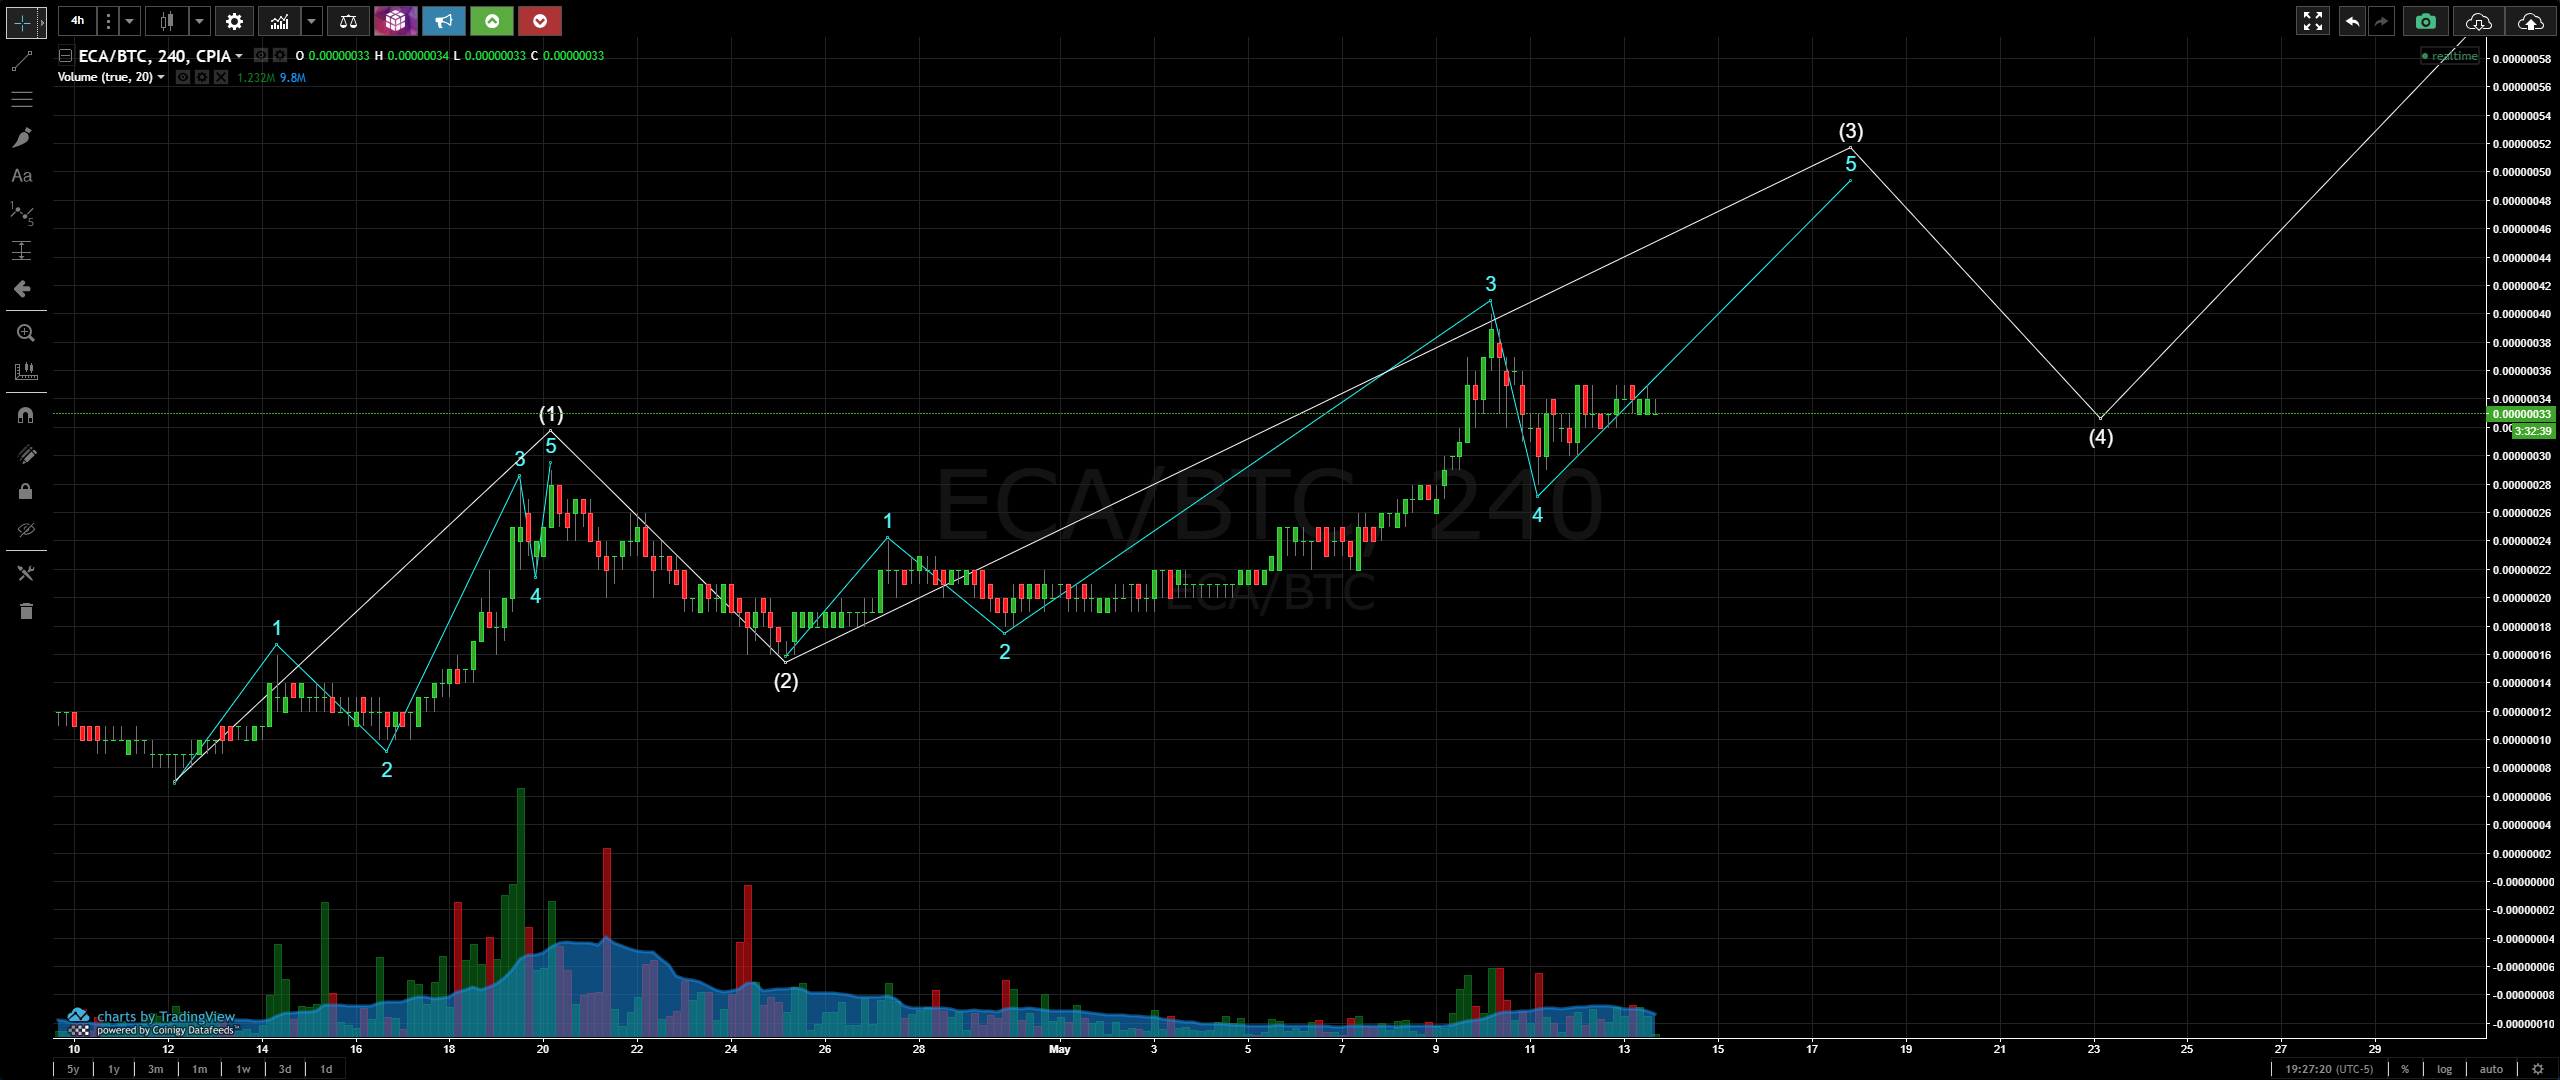
Firstly, as I have continued to mention, I am a beginner. I can and do make plenty of mistakes. Check out the chart below that I posted in this post from two days ago:

One of the rules of Elliott Waves is that the bottom of wave 4 cannot stretch below the top of wave 1. As you can see, the May 11th candle overlapped the top of wave 1:

I of course wish I would have noted this, as it would have allowed me to consider the possibility that a downward trend may continue. Further implying that the following count cannot be correct:

I am now asking myself "okay, so what is the correct count?". For the time being, this is the only other count I am considering, though still I am hesitant. Why? As I've already made clear, the bottom of wave 4 cannot overlap the top of wave 1. BUT...can the bottom of wave 4 bounce off the top of wave 1? If that is acceptable, the following count could be valid:

Another rule to consider here for educative purposes: wave 3 cannot be the shortest of waves 1, 3, and 5. If the above count is correct, the lengths of waves 1, 2 and 3 are 9, 19, and 24 (respectively). So, wave 3 was not the shortest of the 3 impulse waves up. Although, there is something that bothers me about the count in the chart above.
In general, these five impulses upwards tend to follow within a channel of parallel lines. You can see some pretty clear channels occurring in the chart below:

Everything about the above chart tells me to keep the count that I have had for a while now (seen below):

But again, the fact that the bottom of wave 4 overlapped the top of wave 1 leads me to believe that this count must be incorrect. In all honesty, I am a bit unsure where our true count is at this point. Part of me wants to continue with the current count and just write off the whole "our wave 4 overlapped wave 1" due to the fact that Electra has genuinely been over-sold. How could this happen? One huge sell-off from a "whale" (someone who owns many Electra) could cause a domino-effect of individuals panic-selling, thus causing our price to dip far beyond what could have been projected.
Further evidence of this is seen when we check out the MACD:

Two days ago - in this post - the MACD was indicating that ECA is over-sold, yet still it continued downwards. How long will this continue? How long can this continue?? I'm inclined so say "not very long", but hey, I've been wrong before; I will likely be wrong again.
I will set that uncertainty aside for now by directing your attention to what I believe to be some emerging fractals. Simply put, fractals are patterns that we can observe over time. The more of these fractals that appear, the more we can begin to rely on them as a tell of what future price action could entail. Check out the chart below:

In the chart above, you can see three potential fractals. Three bull runs upwards, each of which followed by A-B-C corrections encompassed within a descending (falling) wedge pattern. The falling wedge pattern is characterized by a chart pattern which forms when the market makes lower lows and lower highs with a contracting range. When this pattern is found in a downward trend, it is considered a reversal pattern, as the contraction of the range indicates the downtrend is losing steam.
Each of these descending wedge patterns resulted in a break-out and a bull run that was then followed by requisite correction. The first breakout led to a 190% increase, the second breakout led to a 150% increase:

If these fractals are indicative of future price action, we could expect another breakout. What will it result in? That, I certainly do not know, especially in light of the uncertainty I've had in counting our waves upwards.
More often than not, all we can do is hurry up and wait, as price action is the greatest teller of all.
I hope you found this to be useful!
Legal Disclaimer: I am not a financial advisor nor is any content in this article presented as financial advice. The information provided in this blog post and any other posts that I make and any accompanying material is for informational purposes only. It should not be considered financial or investment advice of any kind. One should consult with a financial or investment professional to determine what may be best for your individual needs. Plain English: This is only my opinion, make of it what you wish. What does this mean? It means it's not advice nor recommendation to either buy or sell anything! It's only meant for use as informative or entertainment purposes.