Developed in 1978 by J. Welles Wilder, the Relative Strength Index (RSI) is a very popular momentum oscillator. The RSI compares the magnitude of recent gains and losses over a specified time period to measure speed and change of price movements of a given market. It is mainly used to identify overbought or oversold conditions.
We calculate RSI using this formula:
RSI = 100 - 100 / (1 + RS)
RS = Average gain of up periods during the specified time frame / Average loss of down periods during the specified time frame.
While most traders will use RSI to find overbought/oversold levels, we can implement the RSI in various other ways to gain an edge in the markets. Let's take a look at how we can use RSI and the 50 level to find the mean value in price.
As with moving averages we can use the RSI to find the average price on a chart. This can be useful as we know that price will always return back to the mean value at some point. This mean value is often referred to as fair value.
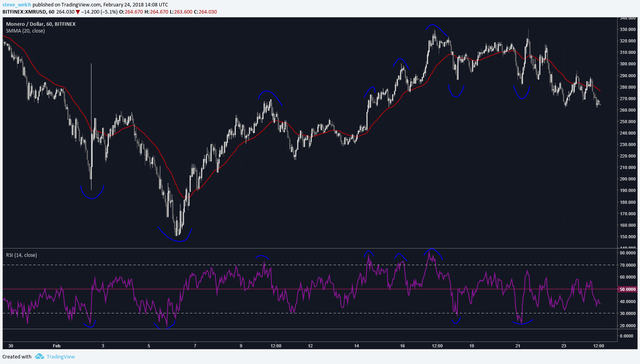
On the chart below I have highlighted areas where the RSI has indicated overbought/oversold values and the corresponding area in price.
Note the RED moving average on the chart. I have applied this as a visual aid only and is not required on your chart.

As price moves down we can see that the the RSI moves into oversold territory, price peaks and begins to retrace.
As the retracement continues price moves closer to the MA and crosses. Notice that as price converges with the MA, the RSI also converges with the 50 line drawn in PURPLE.
When Price is overbought and retraces, the same occurs, price crosses the MA and also the 50 line.
This pattern does not just occur in the extreme. Note that the RSI is heavily correlated to the price chart. Every time the RSI reverts back to its mean value (50) so does the price data with the MA.
Using the 50 line on the RSI can be a useful tool for finding target levels for short term price moves when using the overbought/sold condition as our entry.

We can also implement the 50 line as a tool for identifying short term trends and as entry points for our trades.
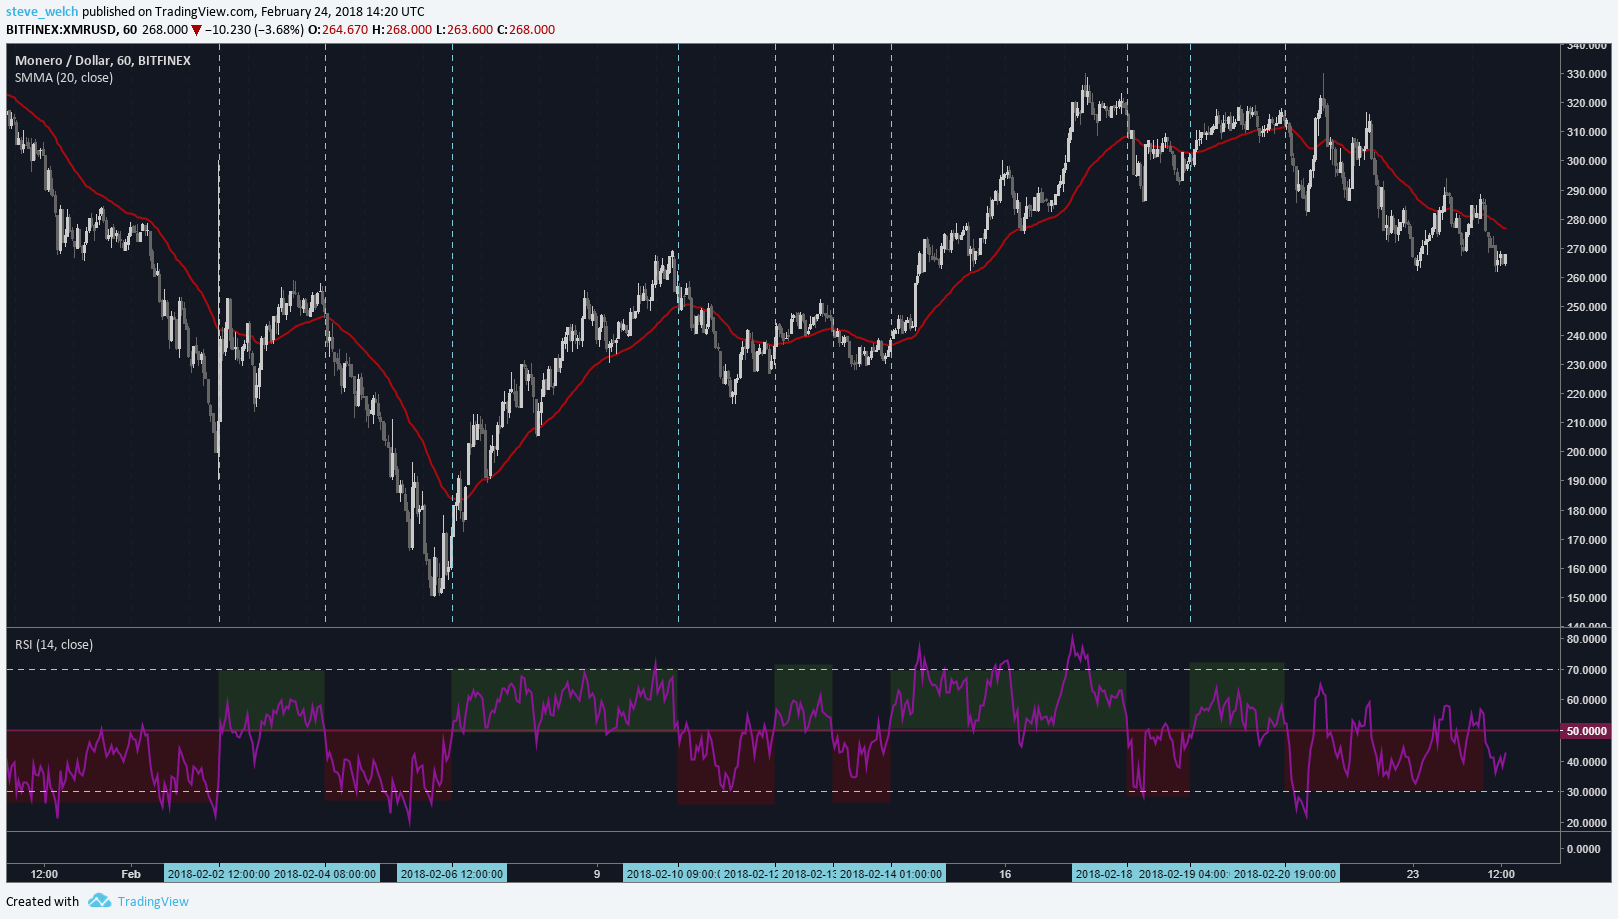
On this chart I have highlighted areas where both price and RSI are trading above or below their respective mean values.
While the RSI is above the mean, it is safe to assume that we are trending up and while the RSI is below 50 we are trending down. When we cross the mean the trend changes.
This can be an excellent second condition for trade entries. First we look the RSI to be overbought, then we wait for the cross over the mean to enter our trade.
If you want to learn about how we can implement Divergences to the RSI click on the link below to an older post.
https://steemit.com/trading/@stevedn3/price-divergence-and-trend-changes-also-a-case-for-a-bullish-steem
As you can see on the charts, sometimes the conditions met by the indicators do not always result in a good trade. I have done this to highlight that indicators are just a tool to aid making trading decisions and are never guaranteed to produce results. Trading is about probability and indicators can help in determining the probability of price moving in a given direction.
If you liked this post or found the information useful please show your support Upvoting, commenting or following. I am trying to improve on the quality of my posts and your support will help alot .
HAPPY TRADING
@originalworks
Downvoting a post can decrease pending rewards and make it less visible. Common reasons:
Submit