Hai Sahabat Steemit di manapun anda berada... Semoga saya dan kalian semua selalu dalam lindungan Yang Maha Kuasa.
Masih bersama saya @toniesteem dalam topik Dunia Trading. Kali ini kita akan membahas tentang cara menganalisa harga Bitcoin dan Altcoin. Sebenarnya, ada banyak cara yang bisa dilakukan untuk membaca perkembangan pergerakan suatu harga dalam dunia perdagangan. Diantaranya ada yang dikenal dengan;
Strategic Analysis (Analisa Strategis)
Yaitu suatu cara menganalisa pergerakan harga dengan melihat trend-trend ekonomi,social, politik, dan fungsi demografis suatu daerah atau negara di dunia. Karena suatu pasar perdagangan tidak hidup dan tumbuh dengan sendirinya. Dia saling bergantung dan terkait dengan berbagai sendi-sendi lain sebua peradaban dunia. Biasanya Analiasa Strategis didasari oleh pertanyaan-pertanyaan seperti,
Apa yang akan terjadi terhadap pertumbuhan Bitcoin jika Indonesia mulai mewanti-wanti warganya terhadap Bitcoin.? Apa pengaruhnya jika beberapa perusahaan Maskapai Jepang mulai membuka peluang dengan penerimaan pembayaran tiket dengan menggunakan Bitcoin.? Apa efek yang akan timbul menjelang hari tahun baru? Apakah bisa menimbulkan pengaruh terhadap pertumbuhan Bitcoin jika rating Jokowi-JK turun drastis.? dan lain-lain. Analisa strategis bukanlah hal yang mudah. Banyak faktor-faktor yang bermain dan akan berpengaruh kepada maneuver-manuver harga diluar prediksi indicator.

Fundamental Analysis (Analisa Fundamental)
Analisa Fundamental adalah sebuah cara menganalisa pergerakan harga suatu Coin dengan mencari informasi dari tulisan-tulisan orang yang aktif sebagai pemerhati pertumbuhan Bitcoin. Kita bisa mencarinya di Steemit, Cointelegraph dan lain-lain. Informasi yang kita cari adalah tentang Profitibilitas perusahaan atau arang-orang yang berdiri dibalik berkembangnya sebuah Coin. Dan Kita bisa mencari tahu tentang bagaimana Coin itu beroperasi.? Berapa persen penyebaranya.? Apakah Coin ini memiliki keunggulan kompetitif dibanding Coin-coin saingannya.? Adapun efek dan keuntungan dari Analisa Fundamental akan terasa dalam rentang waktu jangka menengah dan jangka panjang ke depan.
Technical Analysis (Analisa Teknikal)
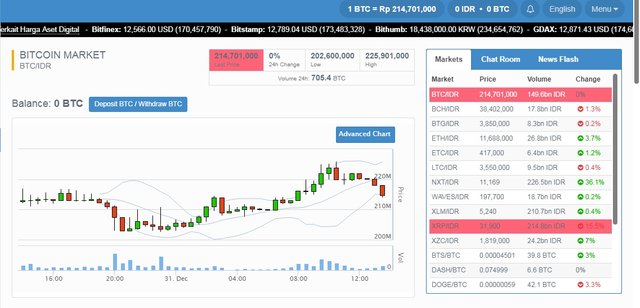
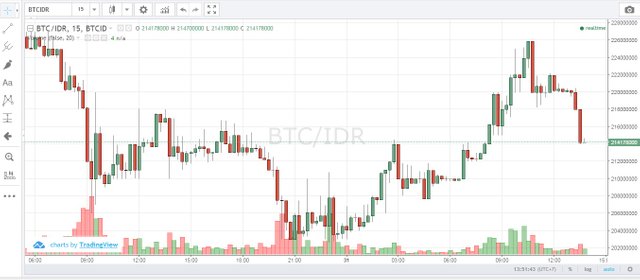
Nah…. Analisa teknikal adalah sebuah teknik yang terbilang sangat mudah untuk dipelajari oleh siapa saja. Karena, disini kita menggunakan sumber informasi dari pasar itu sendiri, yaitu pergerakan grafik harga dan volume transaksi pasar. Lalu Apa yang kita cari dari analisa teknikal? Kita melihat teknikal analisis untuk mengetahui sentimen para pemain pasar dalam jangka pendek.
Banyak metode-metode analisa teknikal: dari candlestick patterns, berbagai indikator seperti MACD, RSI, berbagai geometric patterns seperti W, M, segitiga, dll. Tulisan-tulisan tentang metode-metode analisa teknikal juga banyak bersebaran di banyak web di interner. atau mungkin suatu saat nanti akan kita bahas secara mendetail.
Isu utama yang perlu kita bahas sebelum mengartikan dan menggunakannya adalah memahami konteks kemunculan patterns-patterns tersebut. Contoh simpel: jika kita pernah belajar Candlestick, tentu kita tahu apa yang namanya Doji. Ketika kita melihat Doji, kita harus tahu konteks dari munculnya Doji itu. Misalnya: Apa trend sudah terbentuk sebelum kemunculan Doji? Bagaimana kondisi pasar keseluruhan di hari itu?
Isu kedua yang perlu dibahas adalah evaluasi seberapa efektif teknik-teknik tersebut. Isu kedua ini bisa dibahas dengan lebih baik ketika kita sudah memahami isu pertama.
Catatan # Doji adalah pola yang umum ditemukan dalam grafik candlestick aset finansial yang diperdagangkan (saham, obligasi, futures, dll.) Dalam analisis teknis. Hal ini ditandai dengan ukuran kecil - yang berarti rentang perdagangan kecil - dengan harga pembukaan dan penutupan yang hampir sama. Doji mewakili keragu-raguan di pasar. Sebuah doji tidak begitu signifikan jika pasar tidak jelas trendnya, karena pasar non-trend pada dasarnya menunjukkan keragu-raguan. Jika doji terbentuk dalam trend naik atau trend turun, ini biasanya terlihat signifikan, karena ini adalah sinyal bahwa pembeli kehilangan keyakinan saat terbentuk dalam tren naik dan sinyal bahwa penjual kehilangan keyakinan jika terlihat dalam tren turun.

Tulisan ini hanya sebagian dari sudut pandang yang saya pahami dari beberapa kutipan, dan tidak menunjukkan bahwa saya telah memahami pasti cara-cara untuk melihat suatu perkembangan pasar. Saya masih perlu banyak belajar. Masukan dan kritikan sangat diharapkan.
By @toniesteem
English
World Trading 3 # Market Analysis Strategy Price Bitcoin and Altcoin
Hi Steemit Friends where you are ... May I and all of you are always in the protection of the Almighty.
Still with me @toniesteem in the topic of Trading World. This time we will discuss about how to analyze the price of Bitcoin and Altcoin. Actually, there are many ways that can be done to read the development of a price in the world of commerce. Among them are known as;
Strategic Analysis (Strategy Analysis)
Ie a way of analyzing price movements by looking at the economic, social, political, and demographic trends of an area or countries in the world. Because a trade market does not live and grow by itself. He is interdependent and associated with various other joints sebua civilization of the world. Usually Strategic Analiasa is based on questions like,
What will happen to Bitcoin's growth if Indonesia starts to warn its citizens against Bitcoin? What is the effect if some Japanese airline companies start to open up opportunities by receiving ticket payments using Bitcoin.? What are the effects that will arise before New Year's Day? Can it affect the growth of Bitcoin if Jokowi-JK's rating drops dramatically? and others. Strategic analysis is easy. Many factors are playing and will advance toward price maneuvers outside the indicator indicator.
Fundamental Analysis (Fundamental Analysis)
Fundamental Analysis is a way of analyzing the price movement of a Coin by seeking information from the writings of people who are active as observers of Bitcoin growth. We can find it in Steemit, Cointelegraph and others. The information we are looking for is about the profitability of a company or charcoal-people that stands behind the development of a Coin. And we can find out about how the Coin is operating.? What percentage of its proponents? Does this Coin have a competitive advantage over its rival Coin-coin? The effects and advantages of Fundamental Analysis will be felt in the medium to long-term and long-term future.
Technical Analysis (Technical Analysis)
Well…. Technical analysis is a technique that is fairly easy to learn by anyone. Because, here we use the source of information from the market itself, namely the movement of price graphs and the volume of market transactions. Then What do we look for from technical analysis? We look at technical analysis to find out the market players' sentiments in the short term.
Many methods of technical analysis: from candlestick patterns, various indicators like MACD, RSI, various geometric patterns such as W, M, triangle, etc. Writings on methods of technical analysis are also widely spread on many webs on the interner. or maybe someday we will discuss in detail.
The main issue we need to discuss before interpreting and using it is to understand the context of the emergence of these patterns. Simple example: if we ever learn Candlestick, of course we know what the name Doji. When we look at Doji, we must know the context of the appearance of the Doji. For example: What trend has been formed before the appearance of Doji? What is the overall market condition of the day?
The second issue that needs to be addressed is the evaluation of how effective the techniques are. This second issue can be better discussed when we understand the first issue.
Note # Doji is a pattern commonly found in candlestick charts of traded financial assets (stocks, bonds, futures, etc.) in technical analysis. It is characterized by a small size - which means a small trading range - with similar opening and closing prices. Doji represents the hesitancy in the market. A doji is not so significant if the market is not obviously trendy, as non-trend markets basically show hesitations. If the doji is formed in an uptrend or downtrend, this usually looks significant, as it is a signal that the buyer loses confidence when formed in an uptrend and signals that the seller is losing confidence if seen in a downtrend.
This paper is only partially from the point of view that I understand from some quotes, and does not indicate that I have clearly understood the ways to see a market development. I still need to learn a lot. Feedback and criticism are welcome.
By @toniesteem

Good sharing....
Downvoting a post can decrease pending rewards and make it less visible. Common reasons:
Submit
Tks,, anda memang kawan Setia yang selalu hadir.. Tks
Downvoting a post can decrease pending rewards and make it less visible. Common reasons:
Submit
Congratulations! This post has been upvoted from the communal account, @minnowsupport, by toniesteem from the Minnow Support Project. It's a witness project run by aggroed, ausbitbank, teamsteem, theprophet0, someguy123, neoxian, followbtcnews/crimsonclad, and netuoso. The goal is to help Steemit grow by supporting Minnows and creating a social network. Please find us in the Peace, Abundance, and Liberty Network (PALnet) Discord Channel. It's a completely public and open space to all members of the Steemit community who voluntarily choose to be there.
If you would like to delegate to the Minnow Support Project you can do so by clicking on the following links: 50SP, 100SP, 250SP, 500SP, 1000SP, 5000SP. Be sure to leave at least 50SP undelegated on your account.
Downvoting a post can decrease pending rewards and make it less visible. Common reasons:
Submit
makasih atas infonya gan...
Downvoting a post can decrease pending rewards and make it less visible. Common reasons:
Submit