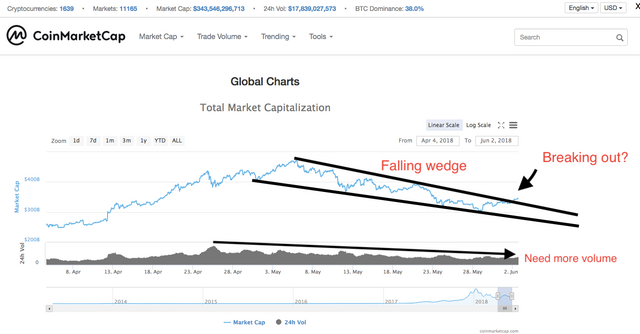
What happen to the Falling wedge?
As BTC found a support at ~$7,000 level and altcoins are generally moving up again, crypto market cap found a support at $300B and currently ~$345B. It looks like the market cap is trying to break out of the falling wedge that I discussed before but the volume is still low. High buy side volume is quite important to confirm bullish break outs. So, the market is getting bullish but bears can come back anytime and the market cap could go down again until we see high buying volume.

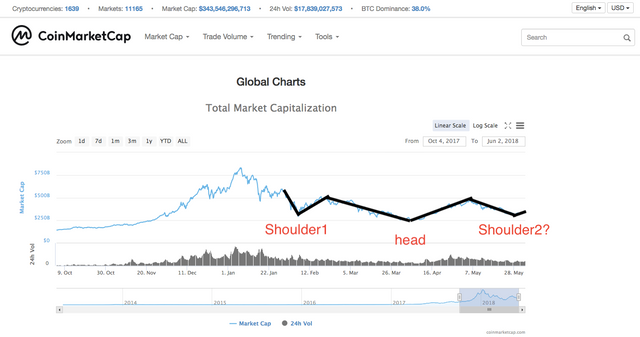
Bullish head and shoulder formation?
Another promising technical indicator that I should mention is 'head and shoulder pattern' in the total market cap chart. As the market cap bounced at $300B, the market cap chart may be forming an inverse head and shoulder, which is a bullish sign. We would see another rally if the market cap can test and break the $500B resistance, which would probably require more positive price action of BTC (breaking out of the triangle) and big fundamentally positive news like bitcoin ETF.

Please upvote and follow me if you like this post. Also, please leave your comment below if you would like to add something to this post.
Did you want me to do some TA on your favourite altcoins? Let me know down below :)
Where I trade : Binance
Follow me on Twitter : Twitter
Disclaimer
I am not a certified financial advisor. This post is just my personal opinion and not financial advice. Please do your own research and do not trade just based on my posts.